GBPJPY BUYThere was big breakout that is currently correcting. I think it will bounce and go from the 30EMA which also lines up with a reactive support.
AND

USDCAD - Comparing Supply and demand with Support and resistanceMost people are support and resistance traders, but they fail to understand why their setups fail. Because institutions know where the majority of people are trading, and will attack these areas when appropriate.
Are you a support and resistance trader, or supply and demand? And which do you prefer?

EURJPY BUYDay chart has hit a major support and 4 day candles have respected it. The next few day candles, in my opinion will be bullish. The Target is at the next day candle closing price resistance and the stop loss is below the day candles respecting the support. The target profit also lines up to where the 30EMA should end up.
Note: I've made a youtube channel that does not yet have any content but at some point in the future i'll be uploading videos about my trading journey and some educational content if you'd like to subscribe now and be the first to see it when i upload. Youtube: Flynnex

NVT signal and Parabolic SARIs the NVT signal saying we are over bought, I think it is. If the Daily/Weekly P.SAR reverses will we see the price turn south and create a profitable shorting opportunity?


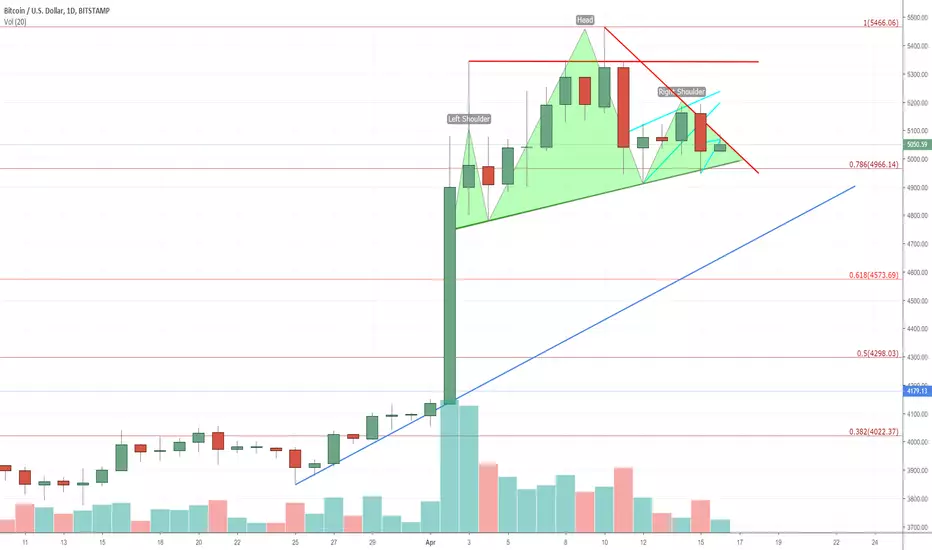
Gentlemen, hold your breath.Both BTC and ETH are at risk of H&S.
Daily NVT not looking good as well.
Please use some caution here.
Buy the dip, but no hurry.
Cup and Handle Reversal with Bullish Symmetrical TriangleHey everyone,
I have been seeing this possibility in the charts and the daily. We could have a double bottom into a cup and handle reversal. We have a potentially bullish symmetrical triangle in the handle as well. If this plays our we could launch into 6.8k in two months for a full retest of 6.8k. I'm an amateur, and this is not trading advice. This is simply a suggestion based off of some research. Let me know what you think. Open to any and all feedback and interpretations.

DXY weekly analysisThe daily chart has been showing an uptrend for the past several months, with HH's and HL's beng made. Until the last few weeks, we've seen that price hasn't been able to form a higher high on the daily, but rather a lower high and price has been wanting to fall down since then. In the 4 hour timeframe, we see signs of reversals with LLs and LHs being made. The 4 hour supply zones have been respected quite well,but so has the demand zone at 96.9 that has been holding several candles from falling further, acting as a level of support. It is also important to note that in the context of the motnhly timeframe, we are MOC, and the weekly timeframe is still an uptrend. A shorting opportunity for the DXY exists, and it would be possible to short until the 96.6 region, where a weekly demand zone is located. DXY has a lot of room to go down in both the 4hour and daily timeframes. A correction may once again happen in the daily and price could definitely go down all the way to the 96 area where we have a nice 4hr RBR which is also where price last went before going back up again. I would not long the dollar right now, but wait for it to go down to get better long opportunities.

Classic cup&handle break of supportAEX formed a perfect cup and handle and subsequent broke through supporting neckline.
Targets might be any of the lines drawn, depends on how US markets will close.

Head & Shoulder EURJPYHello Guys. I started making videos on youtube here with another head and shoulder i just took in 1h time frame. since last week i had some very nice winning trades in row that i show in my videos in response to a trader who was saying that technical analysis doesnt work. Its all about understanding the statistics and the probability and consistency and staying to your plan after losing trades. FxStreamer is my channel on youtube hope you enjoy.

SELL GU on H4 , Head & Shoulder TP on the head downwardSELL GU on H4 , Head & Shoulder TP on the head downward

Update: Cardano Almost there (New Resistance & Support)We almost reached our IH&S Target of 1900 Sats Today.
Target was reached way earlier then i expected. Which means there is more room for growth before ADA summit on 17th-18th april.
If we Break 1900 sats in few days and close above it then we may go towards 2400.
If BTC helps Ada may also reach 3k Sats very soon.
Positive Signal: 50 EMA Crossing 200 EMA on daily chart.
Negative Signal: Weekly and daily RSI|STOCH RSI Overbought. (It may stay Overbought for long period especially when bulls are in Control.)
Retracement Level: Cardano have had very good last few weeks. It may retrace a bit which will be healthy correction. I am expecting a retrace towards 1700. If this level breaks, 1530 sats should hold.
If you were around in last ADA Bull Cycle then you may have noticed that ADA just pumps and stays there for few days and pumps again. Last Bull cycle was from 300 sats to 9k sats and all this happened within 40 days of time.
Good luck trading Ada.

Bitcoin USD - Inverse Head & Shoulder FormingBitcoin in a Bullish channel heading towards the overhead resistance again.
A nice Head and shoulders pattern has formed, hoping for this to finally break this overhead resistance and continue on its bullish charge.

AUDJPY BUY AT NECK BREAK AND CONFIRMATIONHead and shoulder correctly formed and broken the neckline,
I trust it goes up!

GOLD - Short setup with head and shoulders inside decision zoneWelcome to this mid-term analysis of GOLD. Since October until mid February, GOLD traded within a bearish rising wedge. This pattern got a high success rate and is worth taking note of when it’s showing up on charts.
Once we fell out of the wedge, it happened with strength and volatility. Fortunately GOLD stopped where it should, the top $1200s. This zone was the chop from the flag prior to the local top and naturally got a fair amount of strength to it. It’s likely we will flag around the orange zone and down to $1280 based on the fact the flag prior to the local top lasted 30days.
This price action have possibly created the well-known pattern head and shoulders. We had a flag before breaking $1300 acting as the first shoulder, a rally up to $1340 as the head, then a dump down to $1280, the neckline, and we’re now flagging as the second shoulder below $1300.
If you think this setup will play out, I would place a short SL above $1307 to be stopped out ABOVE a local level, and not below it. The potential risk/reward rate is very good if we close this daily candle below $1300.
The orange zone marked have a history of being a point of decision and indecision. This is basically a zone well respected by chartists and traders, and is naturally a turn point for the price action. Several pumps and dumps have ended up inside this orange zone and immediately reversed. This didn’t happen this time, making me think we could have more downside coming.
There’s a certain possibility of GOLD continuing up, so you shouldn’t risk all your cards on the head and shoulders playing out. In case we continue up, I’m looking to close some longs and re-add to my shorts inside the red zone. If the head and shoulders pattern plays out, I will take profit inside the green boxes, and move my SL down manually, trailing the price. My plan is to re-add to my longs around $1210.
That’s it for now! Feel free to share your opinion in the comment section or ask me any question you’d like! Goodbye for now :]
If you like it and would like to receive future updates - Please, follow me on TradingView!
If you follow me, I guarantee you will receive timely updates to this chart, and all other interesting tickers. This will allow you to stay on top of the assets current trend and hopefully maximize your profits!
For support, sign up to Binance and Bitmex with these links for referral
www.bitmex.com
www.binance.com
If you agree, please, Like this Idea - This would be the best feedback and encouragement for me!

BTC: Possible inverted H&S in the makingBTC likes those head and shoulder patterns. Because traders like this pattern, especially the inverted head and shoulder type.
However, we should remember how often this pattern has failed in the past months. So many times, there was an inverted H&S structure in the making, and many times, it failed. It looked as if it would burst through the neckline, just to fail in the last minute, and dump.
We are finally approaching the interesting levels that I have been mentioning since weeks and weeks now.
1. The lower logarithmic downtrend resistance connecting the ATH and the 6500 level where the last big dump started.
2. The higher logarithmic downtrend resistance connecting the multiple smaller tops since early 2018, with the 6500 area. This is the stronger of the two.
3. At the area of the upper downtrend resistance (around 4900USD right now, in 1-2 weeks at 4700-4800USD), we also have the upper weekly BBand and the daily MA200.
4. The number of daily transactions is still far away from ATH: www.blockchain.com
Therefore, if the inverted H&S fails, it will bounce off the lower resistance, the low will therefore also be lower, around 1800 USD.
If the inverted H&S succeeds, we might see a nice rally to the upper resistance, as high as 4800 USD. But this resistance is ultra strong, and BTC is very overbought on weekly, volume still low, no capitulation has yet occured.
Still too many weak hands in BTC, and too many people claiming 3200 has been the bottom. No despair yet! Also, the number of transactions, which I consider one of the strongest metrics for BTC, is still far away from ATH.
All this leads me to believe, that in the best case, BTC reaches 4800, then dumps down to 2400 USD. I see these two scenarios unfold in the coming weeks.
I see almost no chance (of course the chance is not 0%, but still quite low) for BTC going through both resistances, as sorry as I am.
After that final shakeout, we should see a very strong weekly volume bar. Then the low could be confirmed and finally real reversal can start to happen.
The momet of truth comes nearer and nearer :) Good luck!

The LTCBTC Cup and Handle may finally be triggeringThe cup and handle pattern we have been watching unfold on LTCBTCs chart may finally be triggering here as ltc seems to be legitimately breaking up from its current bull flag which ahs a target that should once hit make triggering the cup and handle pattern a sure thing and continuing its bullish momentum...however there have been a lot of fake bait pumps and bait dumps over the last few weeks so we must keep in mind this could potentially be the case again here as well...however with the 1 day golden cross on ltcbtc fully sustained now I think probability favors a legitimate breakout of the cup and handle pattern here.

ADABTC Make Inverse Head And Shoulder Pattern In 4 Hour Chart ADABTC Make Inverse Head And Shoulder Pattern In 4 Hour Chart In Binance Exchange Ada Look Bullish

USDCHF Head And Shoulders formed?Not great in spotting H&S yet. We did have some bullish sentiment in the market and now formed this, that seems to fit in the plan of a H&S.
The shoulders are not higher than the head (the difference is not that great) but the neckline fits in quite well.
When the markets open tomorrow I expect to get an answer on the Idea Title.
Thanks for reading and please give me some feedback on this one.

GE Cup & HandleCup and handle pattern on the daily, if we see a breakout above 11.00 and re test off that level, then that will be my entry, and 11.50 will be my first target, if we hit that and stabilize again, our next target will be 12.75. Ill update this post as time goes along.

LTC looks ready to break up from its handlelooks very good here needs to of course confirm by closing a couple candles above the rimline and seeing a big surge in bullish volume of course too. The only question here is which dotted green horizontal trendline is the more valid rimline. Stochrsi looks poised for a big breakout too. LTC has been one to watch ever since the 1 day ltcbtc goldencross.

ZEC/USD Possible Rally TargetsWe had a nice upward movement last week with the ending of Cypher Pattern. All of the targets were reached less than 5 days and broke out the resistance with a bullish hammer. Let's see if we can trade this possible rally.

LTC may be triggering a cup and handle here.I was expecting LTC to trigger a cup and handle pattern here but compared to the cup this is by far one of the tiniest handles I've ever seen so we will have to wait and see how this develops but so far I'm thinking it still is a valid cup and handle even with that tiny of a handle.
