$7.50 is a no fly zoneNo momentum to break higher - Price instantly gets sold into. This might need to test some support before a new all time high. Not a sell call yet, but soon maybe.
AND

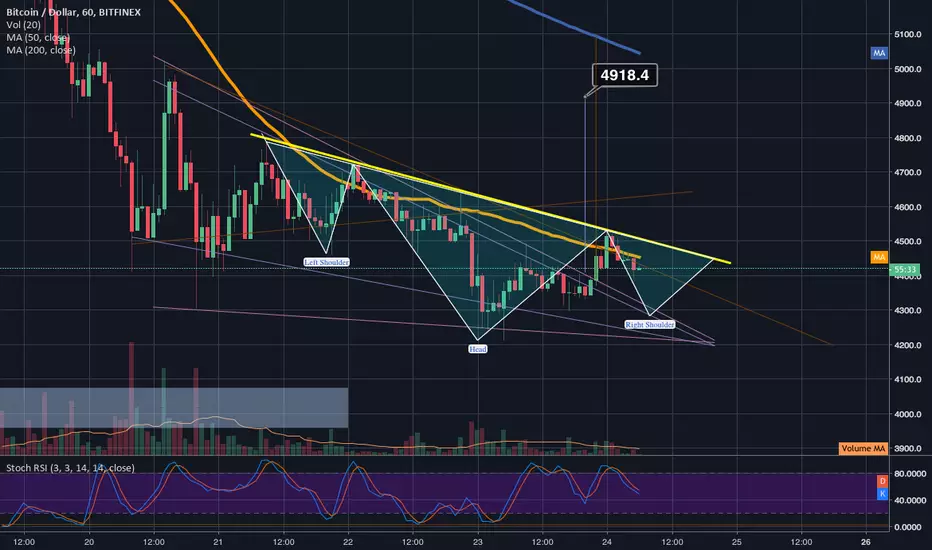
potential inverted h&shoulders overlaid on top of falling wedgeWe are now potentially forming an inverted head and shoulder pattern overlaid on top of the falling wedge which only will increase the odds of a bullish breakout for btc. In order for this inverted head and shoulders to have a chance it must have a bounce before too long and the most likely spot we have as a good bounce support is the top trendline of the falling wedge...if we see it stay above that line odds are good of validating both he breakout of the falling wedge and the inverted h&s pattern but until I see that, this idea will remain neutral for now....if I see it break under the falling wedge trendline I will lean more bearish and think this was nothing more than a dead cat fakeout bounce...but for now we will have to wait and see what it decides to do at the falling wedge top trendline. I may not sell again until it breaks under the bottom trendline of the falling wedge though. The inverted head and shoulders can be seen on the 1hr,2hr,3hr, and 4hr charts. Thanks for reading this NON-financial advice from a NON-financial advisor like myself and good luck!
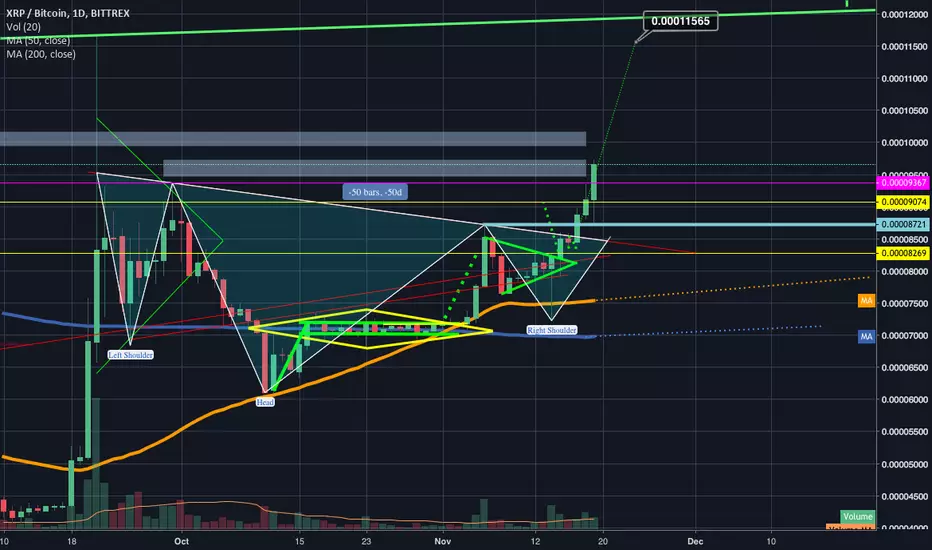
XRP continues bull run breaks key reistance triggers inv h&Swe can see XRP finally broke the resistance of the horizontal pink line. XRPLedger payments volume is really starting to boom as well on the xrpcharts on ripples website. Onward and upward we should hit the inv h&s breakout target within the next 1-3 1day candles is my estimation. Also greatly widening the gap and dominance over Ethereum and making big gains on btc at the same time. XRP is quickly becoming the standard. Once the XRPUSD pair finally gets its golden cross on the 1 day chart and sustains it then we are really gonna be taking off!

EURUSD longEUR use long, headed towards 61,8 fib on daily.
reasons to go long:
Monthly rejection of 61.8 fib ( monthly tf )
Weekly rejection of 61.8 and structure created
Daily:
Break of bearish trend line ending first leg of downtrend swing, now heading towards 61.8 retracement which is previous consolidation area
After the 61.8 is hit 2nd leg towards -61.8 is assumable.
It will be a retest of structure, with at the bottom of the structure the filling of the gap of April 20th of 2017 which is still unfilled.

Xrp now testing inv h&s neckline after breaking up frm sym trnglhere we can see the inverted head and shoulders and how xrp is currently testing the neckline. I have two price target as here in black boxes. The first one represents how high we should climb after breaking up from the small symmetrical triangle(in green). The second much higher price target is where we will go if we trigger the inverted head and shoulder pattern which I anticipate is a very good probability but for now we could still reach the first price target and then still do a fakeout of the inv h&s so be prepared for that possibility. If we do trigger the inv head and shoulder and climb all the way to the second higher price target, the good news is then we will also be right near the neckline of an even bigger massive inverted head and shoulders that could take us all the way to .00025 sats if we were to trigger that one. I anticipate a correction before we would test that one however if we do manage to climb that high...thanks for reading! *not financial advice*

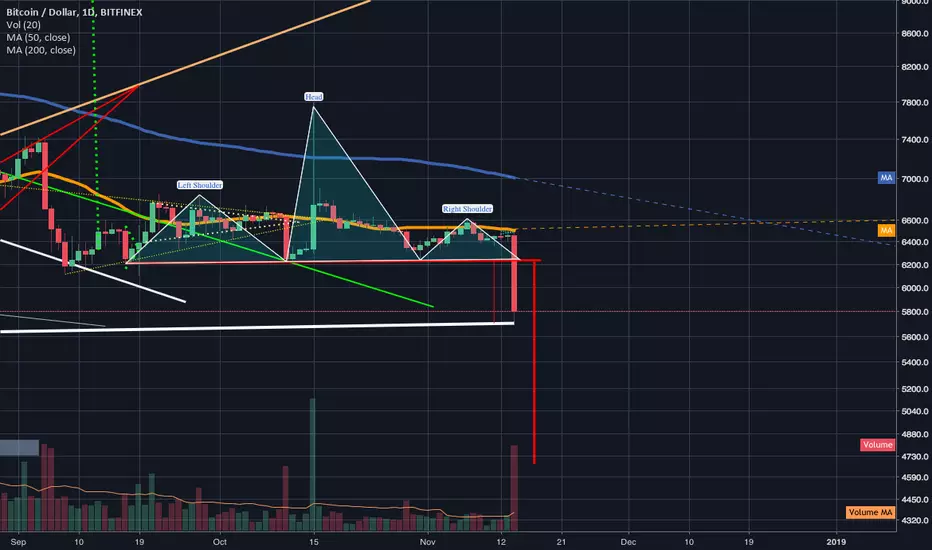
Massive head&shoulders on btc triggers reaches first drop targetbad day in btc today as a big head and shoulder pattern has triggered and reached the first possible drop target which it is now currently wicking upward from. That target was calculated by not including the super tall bitfinex tether wick on the head that happened in october...the second target is about 1,000 lower than that and factors in that massive wick...there's still a chance to hit the lower target of course but because that super tall wick on the head was so manipulated to begin with we may only reach this first target instead...hopefully you all sold when you were given confirmation that the head and shoulders had triggered...I'd say now is a safe place to buy back in if so with a stop loss a few pips below this if it seems we may go for the lower target that includeas the massive bull wick in its calculations. One other very alarming thing here is that we have busted below the support line that has held strong since 2011. That's a very bad bearish sign. Hopefully however now that we have had this massive drop this will usher in the bull season potentially even before the end of the year if we are lucky enough to get one of those massive rebound bounces...For now though things are looking very bearish and there's still a chance we could fall as low as 4.7k on the bitfinex chart.
Huge bullish volume on XEM 1 day chart; Testing inv h&s necklineHard not to jump in on this with that giant volume bar on XEM I say wait until we have a confirmed break above the h&s neckline though that flips the neckkline from resistance to support and solidifies it with either 2 1 day candle closes above it or another huge influx of bull volume once it crosses above the neckline...it's already done a fake out once it could attempt a second and even third fakeout. Be vigilant.

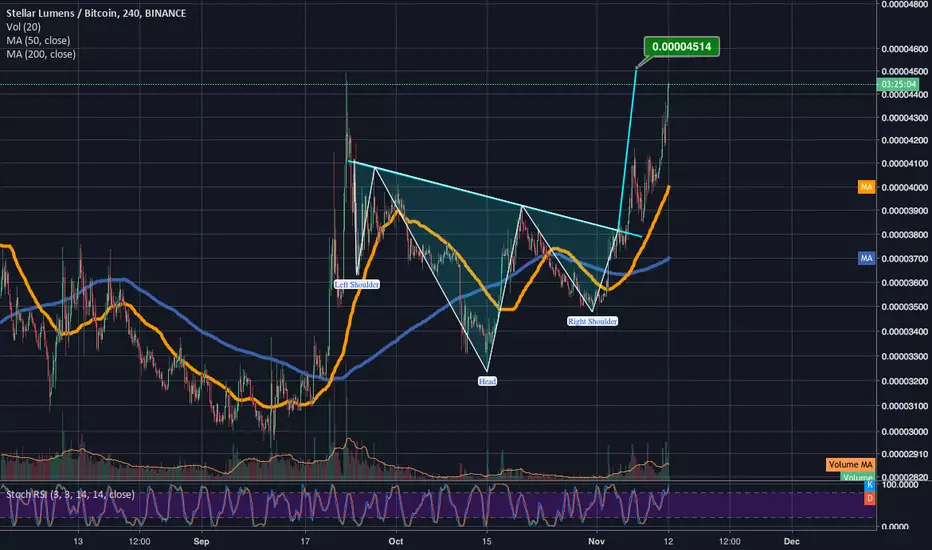
Stellar close to hitting breakout target of the inv h&s idea The inverted head and shoulders on Stellar I told you all to keep an eye on in my idea on November 6th is about to reach its breakout target. Kudos to all who traded with this in mind as I did.


EUR/GBP Sell 10/23/2018Looking to sell at 0.8880 down to around the 0.8500 area. Will hold past target if I can trail a tight stop to potentially run it down to 0.8400


eur/gbp ideaOn the daily chart there has been a candlestick pattern known as the 3 inside up at a major support zone, one of which was also an engulfing candle. One the 1 hour chart there is a bullish wedge being formed.
On the 4 hour chart there has been a head and shoulder formation, subsequently i will wait for a retest of the head and shoulder pattern which is also near the bullish wedges trend line and then i will enter.

Ontology - Road clear for a long positionBuy-and-hold setup.
I have already half of my position.
If price goes lower and the price action looks good, I will take the other half

H&S Pattern appears to have been triggered on XRPIt seems the head and shoulders pattern has been triggered. We are currently at a potential support zone on the 1 day charts 200ma(not shown here) If we can bounce there or at least before the horizontal aqua colored line shown here it will be a very good sign because we will have simply formed a higher low but if we were to reach the projected drop target of the head and shoulders pattern breakdown we would definitely be forming a lower low. Anyone who didn't already get out of their position or short when the 4hr volume indicated the head&shoulders was triggering I would say to wait and see if the 1 day 200ma support fails and even whether or not the priceaction dips below the aqua trendline before shorting at this point you don't wanna fall victim to buying the bottom of this dip.
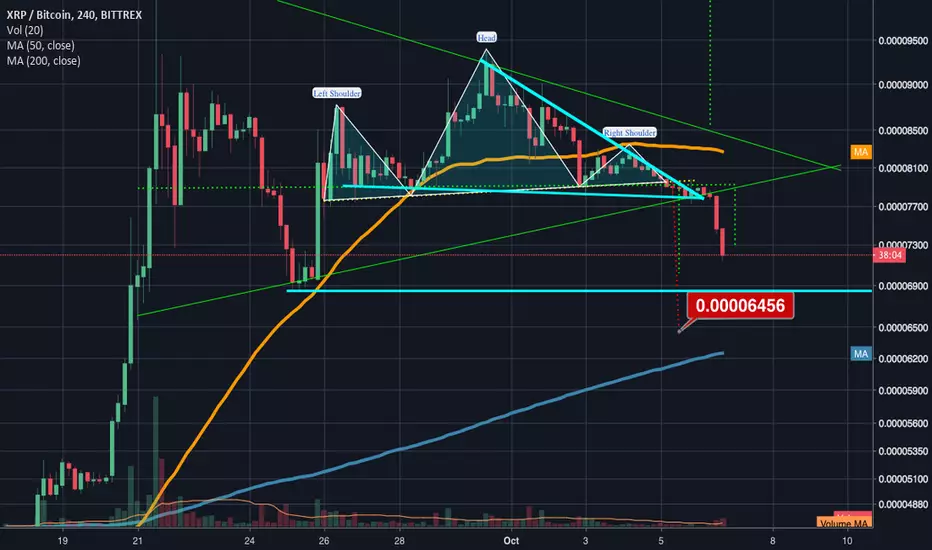
A Bearish and Bullish case for XRPThis idea will be listed neutral because while we still have the very bullish and valid Symmetrical triangle here we have also developed a head and shoulder pattern which is currently now threatening to break the neckline of. Many head and shoulder patterns become fakeouts though so if it is the case that this head and shoulder pattern is a fakeout as well I think that will highly increase the probability of the symmetrical breaking upward like continuation patterns are known to do...Keep a close eye on the head and shoulder pattern though because if it does trigger not only will it initially have the drop target I've posted here in red, but it will also trigger a breakdown of the symmetrical triangle pattern which can dip it the height of the triangle. Do not buy into the head and shoulder pattern prematurely even with it dipping below the neckline best to hodl until we see a bear volume surge to confirm the breakdown. If we break upward the bullish breakout price target is also listed here in green.


XRP 4hr cup and handle pattern overlapping 1day bull pennantShow here is the 1 day chart bull pennant. I will post the 4hr chart below this to get a better look at the cup and handle. The top trendline of the bull pennant is overlapping with the rimline of the cup and handle pattern...which is currently causing double reinforced resistance...I believe however by the apex of this 1 day bull pennant(next 1 day candle) that we will be able to flip that resistance to double reinforced support and continue our breakout upward. We should know by the next 1 day candle....of course always wise to be prepared for the exact opposite outcome as well.

After triggering a 30min inv h&s BTC now forming a normal h&sso far it has completed a left shoulder and a head keep an eye on it to form a right shoulder. If so I will switch from neutral to short if I see it break the necklien and confirm....but only short for a little while considering 30minute head aand shoulders don't typically drop too far.
