swing opportunity the seller is obviously struggling to bring the price lower as there must have not enough selling money down there , price most likely to go higher to find the big money .. most probably will enter this monday , looking for daily candle to close as a pinbar or demand zone created in lower timeframe
AND

We saw a slight bounce but there's a chance of an inverted c&hShown hear is the potential cup of the inverted cup and handle play very close attention to price action and whether or not it dips below this neckline. To trigger an inverted cup and handle here could dip us to 3.6k-4k so I'm hoping this doesn't happen but after the last inverted cup and handle we broke down from its wise to at least be prepares and keep an eye on whether or not this pattern plays out...hopefully we go upward instead 3k is not something this market needs.

Small H&S TopWhat do you think about this possibility?
Small H&S being formed on BTCUSD with a
target of 6200?

BTC New Rocket? Sub Daily I am neutral. Daily I am definitely leaning bullish.
Analysis:
In most of these downtrends with BTC you see several triangle consolidations, and they become more visible with the Heikin Ashi. Right now we are breaking up out of one.
Moving Averages:
On my 8HR Heikin Ashi I have translated 50+200 Daily SMAs as well as 50+200 4HR EMAs.
All MAs are consolidating. The 50 EMA could create a nice rejection off the 200 EMA indicating bullish movement.
The Daily 50 SMA was pressed, possibly indicating a reversal.
Pivots/Fibs/Support/Resistance:
Monthly Pivot was breached but only recently. Weekly S2 was tested and held well.
Previous resistance zone 6850 and local Fib might be turned support now.
TD Sequential:
Daily had a fairly gentle decline, and 8 HR Heikin Ashi put out several bullish indicators recently.


DJIA Dow Jones Industials - Beware the Head and Shoulders DJIA Dow Jones Industial Average Futures: DJIA1!
This was a great short overnight on the break below 25257 line for a fall to the next line at 25094.
It fell to this level exactly.
Perfect, technically speaking.
It should now make a rally attempt back as high as 25245-25257 range at best before it falls away again.
This price action would also form a head and shoulders on this index with a 451 point downside target at 24643. Interestingly there is already fixed support waiting for it at the 24641 line.
Look to short the counter rally and if this fails from lower than we ideally want it to will have to short on a break lower than 25080 with stops at least 30 above.
*For fastest Updates on major markets in real-time through the Summer holidays please check link at top-left of main page. Be lucky !

SandP 500 Index Head and Shoulders Formation
SandP 500 SPX500USD
The head and shoulders formation mentioned in earlier posts has duly formed its right shoulder over the last 24 hours or so - it's higher than it should be for a perfect H&S but nevertheless it still looks quite powerful.
It carries with it a minimum downside target at 7242 which is close to the fixed support line at 2740.
It was a sell once the neck-line broke at 2797 back to the 2790 line for a quick scalp - sorry, was too busy with Bitcoin update to get an S&P update out quickly enough.
Right now it's holding up from a low at 2789 but the counter-rally cannot be trusted.
The mood is still febrile, animal spirits to the fore.
Earning season makes for jumpiness, not helped by Trump's level playing-field mantra playing out across the airwaves.
It's time to look for the next best opportunity from here...
Ideally the S&P will rally further back towards the neck line at 2797-2800 range around the US open before falling away again to the downside target.
And if we don't see the counter rally as above we need to be ready to short once the 2787 level is broken with stops above here by 4 points or so.
We should get some action today.
Get ready!
*For updates to major markets in real time over the Summer hiatus please see link to Global Markets at top-left of main page.
31st July Update
We also have Apple numbers after the close which should give some succour to the bulls today.
It can therefore counter rally to 2809 and above to the parallel immediately above it at likely best before it comes off again.
Eventually it should break the little dynamic underpinning the current counter rally and fall away to 2796 at least and more likely to the 2790 line where it should bounce again. A quick scalp at likely best.
If so it will start to form a potential head and shoulders - perhaps waiting for Apple numbers - which may then go on to create the right shoulder.
Still too sketchy right now to know that though.
At any rate cannot trust the rally yet - at least until we see a restest and double bottom form at 2796.
So far this looks like a dead cat bounce.
Was hoping for better clarity here, looking for a better/bigger short from higher up.
But Apple's figures may just upset that apple cart and muddy the waters even further.
Looks like scalps at best again so far today : (

USDJPY Weekly Trendline Violated! Chance To Go LONG
The weekly long term trendline on this pair has been broken and a potential long opportunity is setting up.
I am currently waiting for the channel that is forming on the 4 hour chart to break and retest the 50 EMA on 4 hr chart. Stay tuned for any updates!
However i will only take this trade when i exit my other active USD position. I do not want to risk my capital buying 2 USD pair at the same time. Nevertheless its a good opportunity and if your analysis meets the criteria you can execute at your own risk!


Up and ATUSOk so 5ish % growth is not that much but it looks like it's found a support at 16.40 I don't know but I have a feeling about this one, can it be a breakout? hmm...

Chain-Link forming a head n shoulder with a 9 forming Chain link forming a head n shoulder with a 9 forming on the support line via Thomas DeMarks sequential indicator....easy 12 - 15 percent gain before it tanks?

mini 1hr h&s pattern triggers reaches target forms higher lowI wouldn't be worried about more downside unless we achieve a lower low...we will have to get below 7800 to do so. until then I will ladder in moderate dip buys. *not financial advice*
possible inverted head and shoulders inside the flagif the inv h&s is legit we have tested the neckline a few times a break of the necklien hsould help get us up out of the flag for good. Left shoulder is iffy but the rest looks legit.
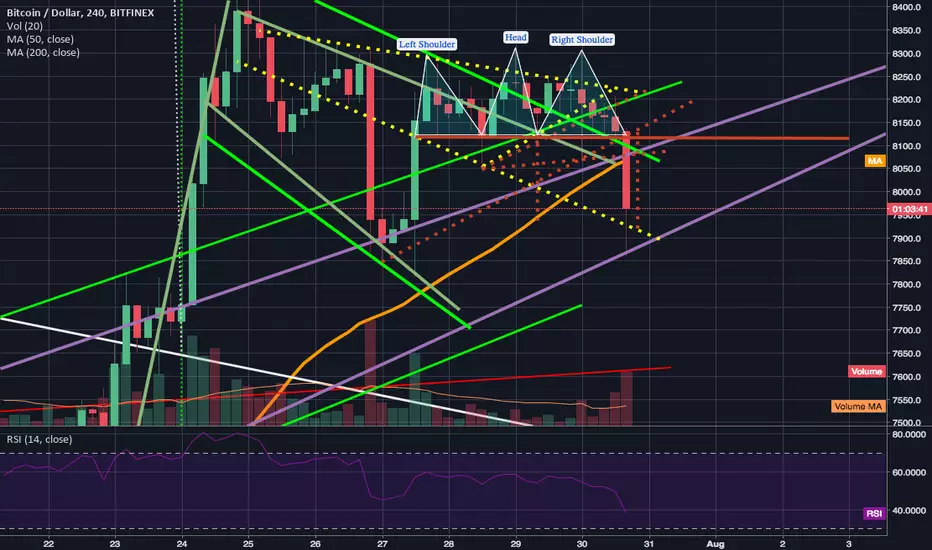
BTCUSD Bitcoin Trade Points and Stops from HereBitcoin Update 26th July 11:16Est 06:16Est
Bitcoin was a buy on a break above the 8160 line yesterday (though by time comment went live it had already broken
higher, sorry- busy day yesterday all round)
It was also a buy if missed the first break on a return to the 8160 line overnight, with the low being 8163 since then.
But the rally is a little lame so far up 100 or so points. Can raise the stop to 8240 for now.
It's effectively back in neutral, yet again in the very near term whilst trading within the range forming overnight and today
bounded by support at the 8160 line and resistance at 8298-8320.
Has to break above 8320 to return to positive for rally back to 8478-8576 range.
Any break above 8600 at any point on rising volume would be extremely positive and can follow long again from that point
looking for 8863 initially and then once broken above to 9367.
Until then the best we can do is raise the stop as above or close out as close to the 8300 line for 140 points or so profit
(if you were around or had orders placed to buy the dip overnight) and be ready to go again on a break above 8320 on
rising volume.
Returning to the downside potential from here: has to break below the first support line at 8163-8155 range to trigger a
100 point scalp back to 8053.
The next support lies at 7944. It must hold up here at lowest on any retests for the uptrend to remain in tact from here.
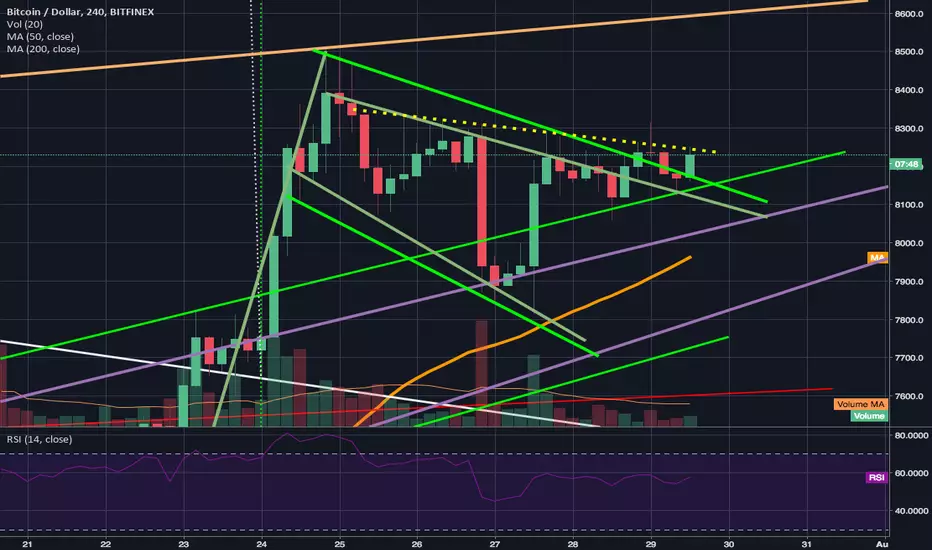
25th July 22:18 Bst 17:18 Est
The bears are really struggling here.
We've had 4 minor waves down with the last being a slightly higher low - there's no momentum building on the downside - there are no sellers .
And if that;s the case it have to move up until there are some again.
The support lines have been adjusted accordingly .
This mofo is trying to break above 8170 as this is finished. It's not ready to go down yet. So it should push up instead.
Which it's just damn well done.
Resistance here at 8230 - must break above here on rising volume to follow long again - it looks ok though to buy the dip if it comes back to 8163 overnight if it sticks here at 8230 - otherwise will have to buy the break higher above 8230 and hope volume picks up behind quickly. If not look to close out again.
July 24th Update
Bitcoin Update 24th July 09:42 Bst 04:42 Est
The break higher duly came at the rather strange hour of
05:00 Bst and midnight Est. Volume has been quite high
though not spectacular. Not much follow through in London though.
It's the first time Bitcoin has made such a small surge
following a break-out higher and it hasn't reached any clear
resistance level either. The rally is a little spooky so far,
lacking real intent.
The long shot from 7800 is going OK but not great so far.
Raising the stop to 7924 for now and hoping it won't get taken before more buyers appear.
* Active traders: For fastest up-dates in real time over the Summer hiatus please check link at top left of main page. You are very welcome to join.

Head and ShouldersLooks like the Head and shoulders is forming quite nicely, and target around 7.7k to the last support, we will still have to wait for the follow through with volume. might be in for some bear flags after that.

Bitcoin XBT Stops Update and Next Trade Points from HereBitcoin Bitmex Update
Not much has changed overnight. It was still a buy on tests of the 7355 line but only for scalps...
If you bought on the second test of this level overnight raise the stop to 7438 for now.
The spikes above price suggest it's still not wanted much above 7500 so far.
The rest stays the same for now, a repeat of yesterday as nothing has changed yet.
On Bitmex feed it's still effectively stuck in the range bounded by three lines of important resistance
at 7615 and 7683 and 7741 and one line of support at 7265, which now needs extending to cover
the spike low.
Whilst inside the range it looks like scalping opportunities at best for now.
Buy on dips towards the 7355 nearest support line with stops just under 7350
looks to be the best option for those looking to trade this inside the range from here.
For others, an eventual break either side of the range should be worth following more aggressively.
Has to break above 7750 on high volume to follow long looking for 8600.
And on the downside has to break below 7240 on rising volumes for next good shorting opportunity,
looking for a retest if 6819-6792 range where it should bounce again if tested.
But until then it looks like we remain limited to scalping opportunities inside the range
*Day-Traders: For fastest updates in real-time please check link at top-left of main page.

The correction for the massive bull pump begins.It had to break down sooner or later a retracement was long overdue. I was able to exit at around 7670 or so which was more than close enough for me to our projected inverted head and shoulder breakout of 7.7k and basically sold the top. It's hard to say just how far we will dip on this next downturn but I'm confident we will only form a higher low in doing so and continue upward...however, in the meantime a short correction is due so hence why I marked this idea short. I see 2 outcomes for this downtrend. a straight drop. or potentially a head and shoulder pattern...If it ends up being a head and shoulder pattern I have drawn a trendline where the head should meet the neckline and projected a rough estimate of how the second shoulder might look. I may put a limit buy in right when the head completes at the neckline with a tight stop loss under it should it break the trendline and keep falling. Ultimately I think once we complete the next breakdown we will likely turn back towards the uptrend from there.

EURUSD- Market is overbought.Making lower highs on the bigger time frames. 3 strong resistances to breakthorugh to reach stop loss, good reward/ratio. Forming a doji on the daily resistance on the 4hr. DXY is also on tough support, seeing a rebound in the dollar will force the (EURUSD) down towards target 1.

Dow Jones Industrials: DJIA1! Stop Management and Trade PointsDow Jones Futures DJIA1! 10:15bst/05:15est 20th July
Despite the counter rally this index still looks weak technically. It should start to come off from around here and
from the upper falling dynamic from the recent highs at 25035 at best.
It should come back to the overnight low at 24902-24850 range later today. It must hold and bounce here to avoid
unravelling further to 24772 initially and then after another mild bounce to the 24641 -24531 range where it should rally
away to the upside once more.
To extricate itself from near term bear clutches it has to find enough buying interest to break above the falling dynamic at
25035 and hold there on the retest.
Dow Jones Futures Update 11:56bst/06:56est 20th July
A nice break lower from a high reached at 25027.
Drive stop lower now, to just 10 points above current price to lock in 100 points or so of profit so far.
* Active traders: for global markets updates in real-time please check the link at top left of main page.

DGB potentially on verge of an inverted head & shoulder breakoutCould be an impending breakout...could also be a fakeout...watch for bullish volume to confirm. Probability favors a breakout with btc being so bullish lately, however there's not much room to climb up on the 4hr stochrsi...so it could still go either way.

BTCUSD Massive Inverted H&S Just HappenedIts important to study what happened so we know what to look for in the future and we know where we are at now. You can see a near textbook Inverted H&S pattern with some slightly off characteristics but nothing is ever perfect. This at least tells us that we are at the beginning of a new cycle and we should be looking at coming price movements that have followed Inverted H&S movements in the past of BTC.
Linked below you can see some of the patterns that formed while this was taking place so we know what to look for when this happens again.

Marico BUYBuy Marico at CMP 332 SL 320 Target 350.
STock almost forming a rounding bottom at 325 ....and inverse head and sholuder pattern

inverted head and shoulders breakout confirmed target 7.7kguess we wont be waiting for futures to expire afterall...not sure if someone got news that an etf was gonna be approved or what. However this breakout should get us to at least 7.7k Maybe there will be a plummet after this before the futures expire..who knows. I hope for btcs sake it moons though.
