series of higher lows still in tact, higher highs broken.We are still at this moment in a continuing series of higher lows on the 4hr which is good but we've actually had 2 lower highs in between those higher lows in a row so that coupled with a new potential head and shoulder pattern leaves rom for concern. I exited my position above the t line at around 7632 and only plan on getting back in around 7821 to play it safe. I may buy back in to accumulate more btc if it dips way low but I might just wait until it reaches this point and shows that it can clear some of these sell walls. That's my current approach. Good luck in whatever you choose to do, and remember this is not financial advice only me sharing my personal strategy that works best for me.
AND

Head and Shoulders on the 4hr chart still in play.I'm keeping a close eye on this...was hoping we would break upward from the latest bullflag but we apparently did a bart pattern instead. If we trigger this head and shoulders shorting is likely wise. I'm trying to be optimistic that we will avoid it though but gotta be prepared in case it occurs. Just putting this info out there so you can make a better informed decision yourself...not meant to be financial advice of course just a possibility worth being aware of. For now I remain neutral and am trying to stay optimistic. The 4hr stochrsi is not in a good position right now either and has plenty of room to drop but I'm hoping it makes a 180 before falling too far. Good luck in whatever path you choose to take.

I haven't given up on the Adam and Eve Double BottomI know I have been focusing on other chart patterns recently while we are still inside the handle of Eve's Cup but I wanted to post this as a reminder that the A&E Double Bottom is still very much valid and I haven't thrown in the towel on it despite us dipping all the way down to $7090. As long as we see a nice bull run in the coming weeks I still firmly believe we can trigger the double bottom. Here is what it currently looks like on the 1 day chart. I also have a feeling like many of the cup and handle patterns I saw in April that the double bottom is actually the deepest part of a larger cup and handle as well. Time will certainly tell if that is indeed a valid fractal or not.

looking to form a higher low..potential h&s in playThe recent dip back to the 4hour 50ma has us looking for a bounce and hopefully forming another higher low to continue the series of higher lows/higher highs. However, it sent a bear wick under the 50ma before bouncing back upward and that wick dropped down to the exact level it would need to complete the head of a new potential head and shoulder pattern. Because of this it is imperative that on the next leg up we form another higher high otherwise the odds of forming the right shoulder of this potential head and shoulder pattern will be of a very high probability. Furthermore if we were to trigger that head and shoulder pattern there is a much larger inverted cup and handle pattern that could potentially be triggered shortly afterwards. Seeing a higher high after this higher low forms is very important, and if not at least an additional higher low or 2 until we reach that higher high. Hopefully this is what occurs...the inverted head and shoulder pattern we just broke above failed to reach its target breakout though so maybe the same would be true with a regular head and shoulder pattern as well. Stay cautious and vigilant and prepared for either outcome and you should be fine. I'm still optimistic of a bull run, but ready for the opposite.

BTCUSD Sunday Chart Update and Key Trade-Points TodayBitcoin Sunday Chart Update and Key Trade Points
So far this looks like a good Reverse/Inverse Head and Shoulders in classic formation with a perfect retest of the neck-line yesterday at 7600 (even more so because no one seems to have really mentioned it - the low today here is 7600 precisely).
It carries with it a minimum implied upside target at 8163 on Bitfinex.
But in the near term Bitcoin has made an 07:30gmt break higher from the 7644 line as it did yesterday too -before spending 24 hours moving sideways again.
The new normal. Sheesh. Every break higher is getting faded now for hours and hours after the intial impulse. £0 minutes of action followed by 24 hours of continuation. Just like fishing on a slow day :(
But this break today is still potentially significant.
We now have a technical battle emerging between the power of the RHS on upside and the power of the upper dynamic of a loosely defined rising wedge-like formation on the downside, both in opposition to each-other, one a positive force and the other negative.
So we can spend quite some time today in yet another continuation pattern with support at 7700 and extending to the lower parallel of the newly forming pattern from the intra-day high.
Both these opposing patterns are powerful. Which pattern will prove stronger ?
Well, so long as the dynamic which forms the lows of the right shoulder holds up on retests today the likelihood is that eventually the break will be higher and not lower.
If so other than buying the dip to 7700 and below to 7768 and maybe to the 7644 line the only other option is to buy the break above the upper small falling dynamic from the intra-day high when and if it comes later on - need a volume spurt to follow it to know it's good - but the pattern is still overall positive at this point and the uppermost risng dynamic which capped the high today so far, is beginning to lose its power and on the 5th strike it should break too. That will open the way for a RHS to take control and begin to drive price towards the upside target at 8163.
Returning to the downside Bitcoin has to break below the risng dynamic underpinning the lows of the right shoulder of the RHS to start flipping longs out back to 7644 and if this then fails to the neck-line itself again at 7600.
This level must hold up throughout the day from here. Any failure by more than 15 points will flip Bitcoin back into bear hands, signalling ultimate failure of the RHS and trigger a short from this point with stops 50 points or so higher if struck later.

EOS in a massive cup & handle pattern could more than doubleIt appears like it may ahve broken up from it's handle will have to see how it reacts when it tests the rimline.

BTC has broken above the inv h&s & falling wedge A good sign for the bulls as BTC has now broken upward from the bull flag it was in on the 1 day chart which has allowed it to break above both the inverted head and shoulder pattern and the falling wedge as well. It is still seeing resistance at the 4hr charts 60 line on the RSI but as soon as we can break above the 60 on the 4hr rsi and flip it to support I think the real bull run will begin...lots of bullish signals all around including the developing golden cross on the 1 day chart which is still probably a week or 2 away but worth keeping an eye on. If the inverted head and shoulder breakout is legit we should see the price action go up to around 8k and test the top trendline of the larger triangle pattern that we have been in since the beginning of the year. Our series of higher low/higher highs is still in tact as well so I still am a firm believer in "To the moon in June!"

Inverted Head & Shoulder Pattern flirting with neckline.If we trigger a bullish break upward from both the inverted head and shoulder pattern and the falling wedge pattern we will next be testing the much larger triangle pattern we are inside's top trendline. Breaking upward from the bigger triangle pattern has the potential to take us to 20k+ and saeeing how we are nearing it's apex as well I think up is going to be the path of least resistance and still am fully behind my mantra of "To the Moon In June!". Also, the original pattern of the Adam and Eve double bottom is still very much in play and I predict all of these bullish patterns will be triggering in the next couple months as well as the impending golden cross on the 1 day chart. As soon as the 200MA on the 1 day chart no longer factors in the climb to the ATH from november-first half of december. The 200MA should drop significantly and trigger the golden cross that will kick the bull market into gear. The 200MA is currently factoring in all price movement from November 13th of 2017 until today....so by July it should no longer be factoring in the climb to the ATH and the 200MA should by then definitely dip below the 50ma on the 1 day chart, if not sooner. Looks like it shold be a bullish summer.

Was the falling wedge's bullish breakout one big long fakeout?Never have I seen a fakeout occur of this nature where so many candles(14!)close above the rising wedge as well as a surge of bull volume to go with the initial breakout and on top of the breaking above the neckline of an inverted head and shoulders pattern at the same time and closing 5 candles above it as well only to have the price somehow eventually crash back inside the rising wedge and try to threaten to break the bigger normal head and shoulders neckline again. These are instances for which TA typically doesn't help they occur an incredibly small percentage of the time but there were 2 TA indicators that were signaling a further drop and that was the cross of the 1day t line under the 1 day 50MA and also the fact that we have formed a lower high on the 4hr chart. I didn't expect 2 bullish breakouts to turnout to be duds though so it's very surprising. Now we are threatening to hit the bottom of the rising wedge and the bigger head and shoulders pattern again with the price action but there is good news. There's a chance we could trigger a standard double bottom pattern with the price we hit on the 18th and shoot right back up. The 1 day chart's RSI is showing that we have reached the oversold zone which gives the beige horizontal trendline indicating where a double bottom would be a lot of credibility as a great bounce support line around $7920. There's also a chance that the original top trendline of the wedge is much higher and we haven't actually broken out of it yet, which is possible concerning this odd fakeout but not enough touches of that higher top trendline yet to change the current wedge lines if we get one more though the top trendline will be raised...If we were to trigger the bigger normal head and shoulder pattern here then that would be quite bad news indeed for it would drop us to around a new drop target of 6300s if it were to occur...I still have faith in the upside for now but will be exiting again if I see a break of the head and shoulders pattern occur. You make your own decisions of course as this is not financial advice. Neutral for now.


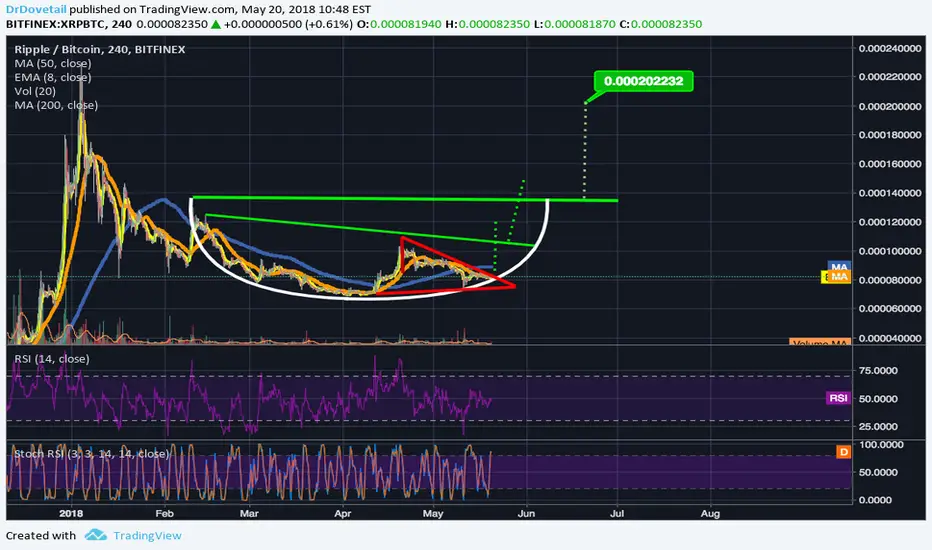
XRP should reach $2 sometime in JuneI'm thinking it will breakout of this triangle then that will send it up high enough to break the inner cup and handle which will send it up high enough to trigger the big cup and handle which should take ripple to $2 sometime in June. For now I like the mantra of "To the Moon in June!"
ETH head and shoulders patternlooks like a head and shoulders pattern is forming and if it drops below the neck line, we will see a drop to at least the black line at 530

[GE] Is It Time For General Electric Bulls to Return?Noticed a Inverse Head and Shoulders pattern looking formation here.
The 50 and 200 MAs also looking to converge around the neckline on 4-hr chart.
The neckline at $15 seems to be important, it has held support after a sharp bounce from the lows in the '08-'09 crisis.
If it can't hold above the neckline, some serious selling could occur unless fundamentals change.
Don't have much fundamental basis for a bull view, though. We'll have to wait and see the next ER!

Head & Shoulders in PlayThe recent bearish breakdown has sent the stoch rsi to the bottom range but with the RSI not yet in oversold conditionas there's likely still more room to fall and the chart is forming a bit of a potential head and shoulders pattern on the 1hr chart. If the head and shoudlers is triggered it will drop us to to the 8,000s so keep an eye out for that...plenty of head and shoudlers patterns have failed to trigger so there's a chance this could be one of them but after the recent death cross on the 4hr I would not be surprised one bit if this triggers. I still feel like the lowest we would possibly dip is $7350 but think 7700-8100 is more likely...and below that thee 7500s seem liek a good rebound zone as well. The ascending grey trendline that has acted as a major support zone in the past is sitting right where the drop target of the head and shoulders pattern ends so it very well could be what finally bounces us back upward and continues the bull run. Choose wise limit buy zones and maintain enrves of steel and you will likely just accumulate more btc during this drop.

Head and Shoulders Pattern I believe that the USD/JPY will continue the normal Head and Shoulders pattern which will conclude in a drop shortly in the USD/JPY. keep your eyes out!

Doge Looking For BreakoutDoge has formed a perfect cup and handle pattern over the past few months. I originally predicted the bottom of the handle to be around 54 sats. With the BTC crash, we fell a little through that, and are now sitting around 52 sats.
The 4h MACD is about to form a bullish cross. The RSI has bounced off the oversold line, and is forming a very clear bullish divergence over the past week. The MACD is also showing a clear, but more subtle bullish divergence. We have just had a bullish cross on the Stoch RSI earlier this morning. All these signs are pointing to a reversal in the price and that the bottom could be (more or less, within a few sats) reached.
If you want to play it safe, you could wait for a confirmed breakout above the blue neckline. I have also outlined a few key resistances that should act as price targets. Currently, the neckline is around 74 sats, putting us at 42% increase from the current price.
*my opinion - not financial advice*

BTC creates a lower low; still forming handle.I exited my position once we dipped below $8790. At that point a lower low had been achieved on the 4hr chart which almost always tends to be just the beginning of further downside. However we are now in oversold conditions on the rsi and the stoch rsis buy signal line is finally curving back towards the upside. We also seem to have a decent sized support buy wall waiting at $8500...because of these support indicators there is a chance we may see a little bit of a bounce at 8500 however i think this will probably only be enough of a bounce to reach the top trendline of the handle before it bounces back downward and sees an even further dip. I believe the downside will continue until btc is finished forming the cup handle and since we've only just now formed a lower lower on the 4 hour chart I anticipate the handle will likely be much deeper than this. Of course I will always be prepared for the exact opposite outcome as well. I hope all reading prepare themselves for opposite outcomes as well.

2 potential cup and handle possibilities for ripple.I think the bigger cup is more probable but they could both be valid. Then again always keep in mind they could both fail, with btc being so volatile lately and most alts movements still in lock step with btc.

ETHUSD Short and Medium Term Outlook ETHUSD
As ETH continues to consolidate it's started to form a new pair
of parallels at a less acute angle but it's holding up and
making higher intermediate highs as it does so.
The medium term trend remains positive whilst it continues to
hold up off the lower parallel on all retests (the recent low
was off the previous rally high)
But in the near term it's struggling under the 765 line after a
high at 768.
Without Bitcoin to give it a boost it can move sideways to
down for awhile inside the two blue lines on the chart and
towards the lower parallel given enough time.
But so long as it continues to hold the medium term trend
remains positive.
ETH nevertheless remains tied to Bitcoin's boot-straps.
In the nearer term Bitcoin needs to break above 9400
to help ETH power higher through 768.
And on downside Bitcoin has to break below 9300 to send
ETHlower towards the 741 line and another meeting with
the parallel.

IOTA/BTC Mid-Term - Cup and Handle IOTA had a very good time in the last few weeks, but is this bullish trend going to continue?
In this chart I just showed the trend movement, channels, and the possibility of having a Cup and handle in the next few weeks.
The Coin is OVERBOUGHT, yet that does not mean it won't go up again. It is more likely to have a correction in the next couple of weeks, which is the best time to go long!
Watch the trend, and do your research before any investment.

Head and shoulder pattern on the 1h AUD/USDA head and shoulder pattern has formed on the 1 hr Chart, with some of the recent momentum it may just breakout.

Head & shoulders triggered on 1hr chart pushes eve back to 5\13good time to short when we saw the priceaction break under the neckline with a noticeable surge of bearish volume. the eve trendline's trajectory has been pushed to the right significantly due to this and for now will still be able to reach the double bottom neckline by May 13th but only if we don't see further downside. If we do see further downside I anticipate the rebound support will be found at the 4hr charts 200ma line (shown here in blue). We may possibly throw a bearwick just below it at 9200 but I anticipate the candlebody's support will be found at the 200ma. If we dip further we also will most likely have to push the date of the eveline's connvergence with the double bottom neckline back further as well. I only expect to be short temporarily but I'll be prepared to ladder out more if the opposite of my expectations occur. you make your own decisions however for financial advise this isn't and your advisor I am not. Good luck and thanks for reading.

ETHUSD Ethereum Long and Short Term Outlook from HereETHUSD Long Term/Short Term Price Forecast
Per Adua ad Astra
Long Term
That low at 360 was as big and meaningful as Bitcoin's at
6000. Perfect Gann numbers too. Like, reeaally PERFECT.
Those lows are equivalent of the lows reached in the first
internet cycle when Nasdaq Composite fell from 5136 to 1118,
a decline of 78% in magnitude, playing out in 4 large waves
over 31 months.
For ETH the fall was from 1417 to 360, a decline of 74% - in 3
large waves over less than 3 months, so 10 times the speed of
the Nasdaq/Internet generation1 exactly.
Look what happened to Nasdaq Composite since: now at 7209
- up nearly 7 times over 16 years.
No real reason to figure that the Alt markets will perform any
differently in the longer term. Just 10 times quicker maybe!
And if that's the case it's effectively a buy dips market for the
next 1.6 years or 18 months or so - during which time ETH can
reach 360 x 7 = 2520. Stay long and keep tracking it as it rises.
Time will tell, as always.
Shorter Term
On and on towards the stars - a little local difficulty at 820 in
very near term but it should push higher with Bitcoin still
driving both Northwards but ETH still outperforming
beautifully.
This has already become the key larger market player in the
resurrection we see across the market in general. Could be
Google back in the day...
It should push on to 869 and 896 (900) and later to 978 where
it should spend time consolidating before breaking higher stiill
(add at this point) to 1400 and yes, one day to 2520 too.
Time will tell...never fails.
Here's to ETH. Let's hope it doesn't either.
