BTC forms another higher low; double bottom trajectory adjustedI didn't bother shorting this recent minor correction dip because 1. We didn't form a lower low first and foremost and 2. We maintained support at the 4hr 50MA buy/sell line (in orange). I did however have to slightly widen the trajectory of the double bottom Eve trendline(in pink) to make room for that extra red 4hr candle...which has pushed the projected date for when price action should meet the neckline of the double bottom back a few days to May 3rd. So far just a minor road bump, and we are still well on course to validating it. As I said in my previous idea I'm noticing a reoccurring fractal all throughout many altcoins right now that I think may give us a clue of what to expect after we were to trigger the double bottom and hit its upward projection. I wanna make sure before I bother putting a hypothesis like that out there, that I make sure we are out of the bear woods first (which I believe we are) but I will still wait for one o my next couple of upcoming ideas I post to go into more details about my thoughts on this. For now I'm just happy to see the Eve line we've been following all month is still in tact and glad the bulls still hold the reins.
AND

Storm's Cup and Handle has Tremendous Upside.We can't be certain Storm'ccup and handle will trigger...but in the current context of the market probability is very high that it will and the upside is huge...the cup is so deep that even at its downward slanted angle Storm will; likely double in price. Of course this is just an assumption based on technical analysis and meant to be my own personal strategy not any sort of financial advice for I as alwayts am no financial advisor. Best of luck with whatever strategy you choose to implement for yourself.

Stellar's Cup & Handle is Nearing its NecklineAn agressive trader would enter here a conservatie one would wait for 1 hr hour close above the neckline. In context with every other cup and handle that have been triggering around the market the risk/reward ratio right now is very good to ladder in fractionally ahead of tim with smart stoplosses....always most wise to wait for the breakout and a 4hr close above though. Keep an eye out and you make your own decisions because this is not financial advice.

Nearing the neckline; being squeezed between 4hr Tline & 50MAPrice action is currently being squeezed between the 4hr buy/sell line(50ma) and the 4hr tline(8 EMA) and should shoot one way or the other soon enough. I expect a break upward even though it's currently forming a bear flag(which usually breaks down). A break below the bearflag could take us as far down as $7938 but if we go up then we could hit the neckline of this double bottom pattern by the 29th of April. Even though the bearflag(in red) which tend to break downwards has formed, that bear flag has formed inside a falling wedge(in tannish green) which have a tendency to break upwards. Often times these patterns become bear patterns cloaked in bull patterns or bull patterns cloaked in bear patterns. A break up from the wedge would only result in a projected uptrend target of $9238 which would continue skimming along the top surface of the eve trendline(in pink)'s current trajectory....however breaking up from the bearflag could have enough momentum to take us to $9874. It all depends on which pattern is more valid. They may both be valid. If either pattern breaks up the trajectory of the Eve line does not change and we would have a current projected date of April 29th as when we could reach and test the neckline of the Adam & Eve double bottom...If we broke downward, that would put us under the 4hr buy sell line and also give us a lower low which would mean a shorting opportunity, taking us all the way down as far as $7938 and significantly changing both the trajectory of the Eve trendline, and also which date it would reach the double bottom's neckline. As long as one is prepared for both potential outcomes, both outcomes can be a solid opportunity and fortunately neither will nullify our double bottom pattern. For a multitude of reasons I think probability favors a break upward, once the 50ma and the t line are done squeezing the price action I anticipate the 50ma teams up with the eve trendline and should have enough combined support to shoot the price action above the t line. So for now I am still long, but I will be ready to short should the opposite outcome occur. You of course make your own decisions as this is only my personal strategy and in no way meant to be taken as financial advice. Good luck and thanks for reading!


BCH had its turn at the front of the pack now its ethereums turnEthereum is the next big Crypto to break the neckline of their cup and handle pattern and it's off to the races...as you can see here the projected target of this breakout is significant and was worth me putting some of my BTC holdings into ETH during this ride. ETH is one of the premier coins/platforms in crypto and it should be a mainstay in the future...coinbase seems driven to allow the ETH eco system/virtual machine to thrive from recent announcements where they underscored their extended support for not just Ethereum but ERC20 tokens in general so with Coinbase so invested in Ethereum's success I think it will be a mainstay for many years to come and worth holding at least a 10% position in if not more.

DOGE - 10% Drop Before Next Bull RunDoge is in the process of forming a perfect cup and handle. This last little run has DOGE severly overbought on the 1d RSI and the 1D MACD is about to form a bearish cross. The handle target is around 54 or 55 sats. If we see a breakout above the neckline, the first target is 79 sats, followed by 91 sats. From here, if the bull run continues, the next two major resistance levels are 114 sats and 144 sats.
*My opinion - Not financial advice*

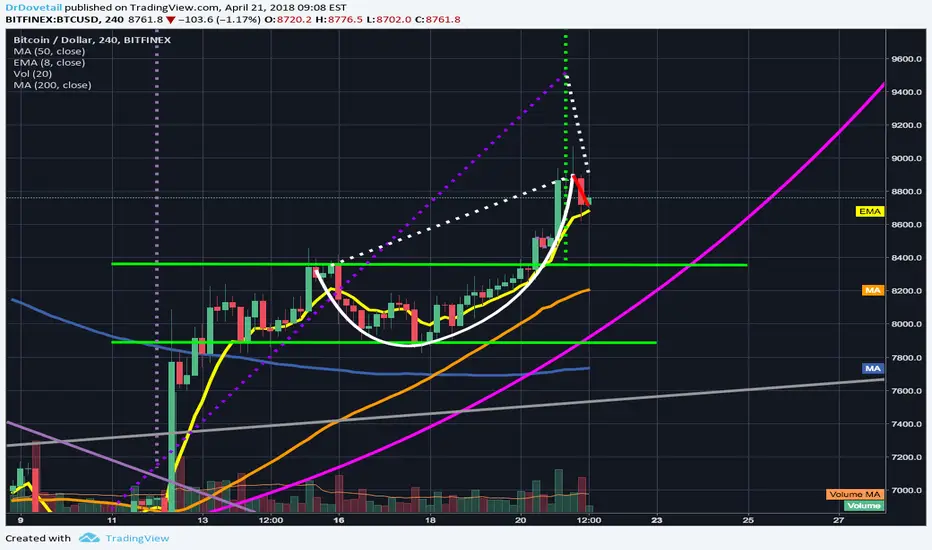
Just closed the 1day candle as a bullish engulfing candleA very good sign as the 1 day candle manages to close as a bullish engulfing candle, and also finds a way to close just above the most recent 4hr bullflag. This greatly increases our odds of a bullish breakout from this flag and as you can see by the vertical dotted green line the projected breakout target should give us enough momentum to hopefully escape the rising wedge the price action has been trapped in recently with a breakout upward instead of the typicall downward break most rising wedges tend to break. Many people questioned why I went with the normal flag which is using the candle bodies as trendlines in stead of using the wicks as trendlines and going by the symmetrical triangle pattern. I personally find more success with flags and wedges when the trendlines adhere to te bodies and not the wicks...but sometimes the wicks will be the prevailing trend...this flag/triangle had morphed back and forth so many times over it's 3 day consolidation that I decided to put both possible shapes overlapping eachother and the funny thing is it turned out they were both valid and both had the exact same breakout target. It goes to show you that both trendlines that stick to the wicks and trendlines that go by the bodies of the candles can be valid...an in this specific case they can simultaneously be valid. Anyways, after all the cup and handles forming and triggering around the alt coin market today as I pointed out in a previous idea, i think that is a great sign that we have much more bullish climbing to be done. We may have a retracement to reset rsi, stoch, andd mach d levels back to favorable positions for a climb for part of this 1 day candle but I have a feeling this upcoming 1 day candle should be quite bullish and anticipate we will finally go Super Sayian mode again (OVER NINE THOOOOOUSSSAND!) during this new 1 day candle. Of course these are just my personal assumptions and not emant to be taken as financial advice so you make your own decisions and I'll make mine. Best of luck and thanks for reading!

Cup & Handles forming all over cryptomrkt; TRX just broke above!I never thought I'd find myself posting an idea chart for crypto but I have been following all these potential cup and handle patterns forming all across the crypto market closely all day. It seems as if Bitcoin Cash and Zclassic were the first ones to trigger....meanwhile other great alts have been slowly forming their respective handles to their cups all day including, Siacoin, Bitshares, Digibyte, Digital Note, Ripple, Steller, Cardano, Iota, Storm,BNB, and Ethereum just to name a few....most of those cups and handles have completed their handles and are now trying to rise up to break their necklines some still are finishing out their handles....but the first big one of these alts to break the rim/neckline of its cup and handle pattern appears to be none other than Tron! After zclassic,bitcoin gold, and bitcoin cash....Tron is next out of the gate to achieve cup launch which is a great sign for the odds of btc continuing its bull run...the more alts that start triggering their cup and handles the better the odds of us being able to break upward out of the current rising wedge BTC is stuck inside. Here on this chart I have drawn the breakout projection with the appropriate pricepoint on top...not a bad idea to take a ride on the troncycle to the top of the dotted line and then see if fomo or any other factors allow it to continue up any further. For me this will likely be a short term entry and not a long term hold. UYou choose your own path however because this is not meant to be taken as financial advice. I expect many more cup and handles in the alt market to trigger not much longer after tron so keep your eyes out on any cup and handles I may not have noticed and also keep your eyes on the ones I listed above. Thans for reading and good luck

My Two SatoshisRising Wedge(Purple) / Head and Shoulders (Yellow)
Upper Major Downtrend Channel Line Red
Log Scale Chart
DYOR


Bitcoin forming inside bars…is this a valid Cup and Handle?Great upswing yesterday just as I was hoping and we are still continuing to play out this potential Eve double bottom quite perfectly. Eve bottoms have a much slower climb than traditional double bottoms and tend to fake out a lot of bears along the way with many a bear trap. We are currently consolidating with some inside bars and we are overdue for a retracement...we may fall back down to around the top trendlien of the bullflag we broke out of on the night of the 19th to form a higher low and then continue ridsing from there....however this current price action on the 4hr chart looks suspiciously like a slanted cup and handle....I'm not entirely sure if cup and handles can be valid at this angle but have charted it just in case.....if it is a cup and handle and we break the neckline after now having formed the handle then the projected upswing target should take us to 9400 which was the original descending wedge breakout target so we will finally reach that projected target which if you look at the price action since that breakout it really has only been higher lows and higher highs...a clear bull run so far. For now though I will keep this idea neutral as we may have a slight retracment which we are overdue for that takes us back down to the top trendline of that april 19th bull flag...if so I will simply buy the dips...you choose your own path though because this is not emant to be financial advice. Thanks for reading and good luck! Also if anyone who is a cup and handle expert sees this and can chime in on whether or not this one can be a valid cup and handle it is appreciated..I know in the standard stock market...patterns like this are suppose to form over a much larger period of time...but in crypto every thing seems accelerated and I've noticed these longer time frame patterns being triggered and validated on much shorter timeframes.
OMG - Small Dip then MoonOversold on the RSI, Stoch RSI has bearish cross. Forming an inverse head and shoulders pattern. Hold off on buying for a couple weeks and watch for the shoulder to form. I'm hoping for a dip of about 10%. Remember, with another crypto bull market beginning to form, pumps can happen very quick, so watch closely! Or, buy now and stay on the safe side, we will see some serious gains soon. :)
OMG has been on a lot of peoples watch list since its release. 2018 will be a big year for OMG, with the wallet and staking going live during Q2 this year. When it first released, the hype for OMG was huge, but it slowly died down. With the live product coming closer and closer, expect that hype to build back up, as well as staking to remove portion of the token supply being traded.

ONT Head and ShouldersONT looks like it has created a head and shoulders pattern if it breaks the neckline then it could fall to where my red line goes.

Still potential for Head and Shoulders on BTCEURIts still possible for the head and shoulders pattern on BTCEUR to play out. Waiting to see if we continue up or we reverse to complete. Potential Reversal for a SHORT.

Um... is this what I think it is???Potential Cup and Handle pattern on Bitcoin 3.82% , target 10.5k. Enter only on breakout or at the bottom of the range. Keep in mind handles often break down and form a second handle before breaking out. TRADE AT YOUR OWN RISK.

UPDATE: $wpr cup&handle: handle is forming perfectly #wepowerOn the 4hr chart, you can easily spot the formation of a cup&handle pattern, perfectly drawn.
At the moment the handle is forming nicely as i sad around 1/3 depth of the cup around 1560 sats and consolidates there.
We will see a huge uptrend in the next days.
indicators like rsi and macd are resetting.

Head & Shoulder, Ascending broading wedge, and 4hr golden cross.On the 4 hour chart here you can see the head and shoulders so far has avoided being triggered after the 4hr candle price action rose back up above the head and shoulder neckline before 3 closes..However on the current 4hr candle, it is now dipping back below the neckline so odds are good it will eventually still break down from the current broadening ascending wedge wedge which when it comes to ascending broadening wedges 76% break out in the same direction as that leading to the pattern which in our case is downward...so currently probability favors more downside but as you can also see we just now on this candle have an official 4hr golden corss of the 50MA moving above the 200MA...such a cross is more effective when it happens on the 1 day chart but it also typically allows for some more bull momentum when it happen ons the 4 hr chart as well just not quite as effectively. Because of this golden cross I think it's very likely that zone could act as strong asupport when the price action breaks down to it and could provide enough of a bounce/rebound back upward that we get back above the head and shoulders neckline before having a chance to trigger it for more downside...becoming instead a bear trap. We could also still dip below that and instead find support at either the ascending grey trendline, or ultimately the pink eve curved trendline....we could dip to those and also rebound back up before triggering the head and shoulders....however if the head and shouldersdoes trigger its projected fall could easily break nudner the pink eve trendline....then again since that trendline is somewhat of a projected line it can be adjusted a bit...possibly even enough to account for the projected fall of a head and shoulder trendline...however I'm fairly confident based on all the previous candle body touches that have verified that trendline up until now that its trajectory is pretty close if not spot on. For now I am going short expecting a fall at least to the 50ma, but also being prepared to pull right back out if it goes down further to get in at the pink eve trendline. You choose your own path of course because this is not meant to be financial advise. Thanks for reading and best of luck! I'm only short here for the short term...and think there's still a chance to avoid this head and shoulders.

bearish brkdown of bear pennant; below Head & Shoulders necklinethe bear pennant did what probability expected it to do and finally broke down...as it did it has now dipped below the neckline of the head and shoulders. There is a chance on the new 4 our candle that one of our 4 support lines can break its fall and bounce it back above the neckline of the head and shoulder before this 4 hour candle closes to prevent it from triggering but there's also good odds that we may indeed trigger the head and shoulders. A solid support rebound zone would be the 4hr 50ma...potentially even the 4hr 200ma but more likely the 50ma....I shorted but put fractional buy backs at 7777, and 7641. there's still good odds we could dip further than that...however I see that the ascending trendline is now overlapping the eve pink curved trendline to create a double reinforced support so that could be a good rebound zone as well. I'm hoping we dip to the 50ma and then proceed to be bounced back above it before the 4hr close there by avoiding triggering the head and shoulders...if the head and shoudler is triggered and validated we could potentially dip below the eve trendline on a wick before rebounding but that doesnt necessarily invalidate the trendline instead it may just need to have its angle slightly readjusted since its currently a projection angle...changing the angle slightly of the eve could maintain all the previous candle touches it has while being able to encompass wherever the drop takes us as well..anyways for now we are short at least to the 200ma and probably the 50...and possibly even down to the eve trendline as I predicted a few ideas back that we would find our way back down to it after the bull impulse subsided. Best of luck out there this is only what I'm planning to do and not meant to be taken as financial advice...goodluck and thanks for reading.
