Adam Eve Bottoms with flag for upward move6K Bottom was nice Vshape 6.5K grind was slightly less deep but much longer time spent. Handle is forming now? I think if it is the next move is most likely UP in dramatic fashion. I set it to the Order blocks we I believe we will have hardest time to overcome near 9700-9800.
AND

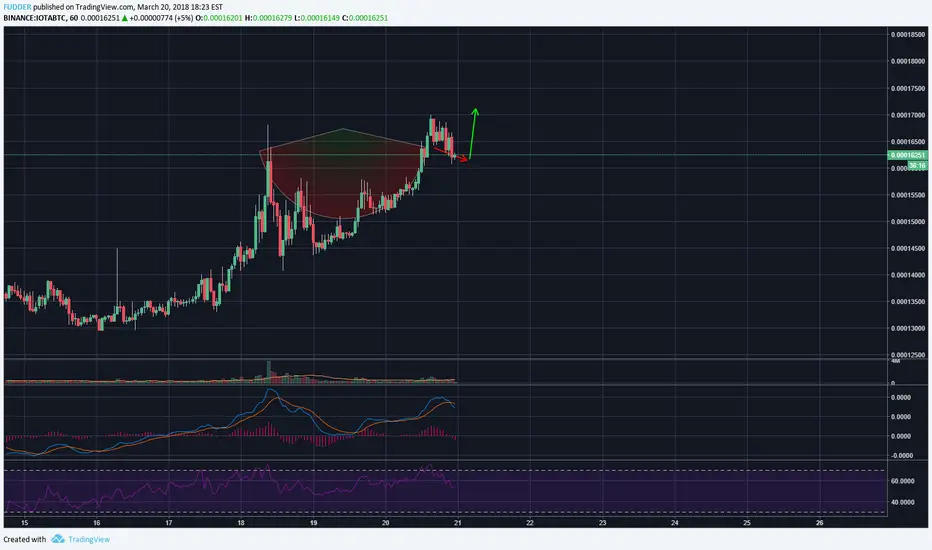
Slight upward movement; Still inside bear pennant…Potential H&S?We seemed to potentially break upward for a second from what was lookign finally like just a standard bear flag....but once again after no huge impulse in volume followed the upward movement it became clear that we still hadn't ahd a breakout and lines needed to eb adjusted once again....We can now see that we are still inside an ascending triangle of a bear pennant and since we have now gone up in price action, that puts a potential head and shoulders in play....Should we dip again by having a bearish breakdown from this bear pennant it would very likely have enough bear momentum to break the neckline of this currently hypothetical head and shoulder pattern....a break of that head and shoulder neckline and thus a validation of the head and shoulder pattern would be bad news as the projected price drop target would take us under the current projected upward slope of the Eve Bottom to around the 7300s. That would not encessarily invalidate the eve it would simply mean that the upward slope may be wider than originally thought and need adjusted....but needless to say it is a much better outcome overall if the price action can find a way to break upward out of this current bear pennant. For now, I am neutral and hodling my position....but am prepared to short with a stop loss around 7830 should we break down from the current pennant. You choose your own path as this is only what I am doing and not financial advice. Thanks for reading!

EUR AUD HEAD AND SHOULDERS PATTERNIm not too keen on diagonal head and shoulders but this looks like a good opportunity given that it stays below the neckline after market open (Y)

Busy week continues, Retest of Rising Wedge, Long AUDUSDHi guys,
The busy week continues, I just put in a buy order on AUDUSD as shown on the chart. Price has broken out of a horizontal resistance/support zone aswell as a trendline which is part of a rising wedge, it has now rejected the top of the zone twice in the same day and decelerated.
I don't like the 50 EMA being in the way and getting rejected. I am also not satisfied with the lack of a deeper pullback. Significant MACD Divergence would've been great also. However this trade still has 5 confluence factors. Because I know my strike rate on those setups I know that I posses an edge over a great amount of trades. That is why it's crucial that I trade my plan regardless how I'm feeling about the trade.
Happy trading

USDCHF Long, Break & Retest PatternHi guys,
coming from a slow week last week we are now getting another setup. USDCHF is retesting the recent horizontal support zone with a lowtest, while also rejecting the major 0.5 Fibonacci retracement level. A 50 EMA retest would've been awesome, but this price action is enough for me to justify an entry. With 5 confluence factors this trade is a B in my category, and thus its fitting my trading plan.
The stop will be set below recent price action, the target is set at the recent highs and the next horizontal resistance level.
Happy trading


H&S with right anglePreviously I posted a Head and Shoulder Pattern forming at around 7.200$ BTC/USD Price.
I exaggerated (got wrong) the downtrend angle. I also wasn't aware of Chinese Holidays until recently. That (to me) had a huge impact on the trading volume thursday and friday.
Still Weekend worked out as expected.
This is an update of the H&S pattern that I thought was forming but with a correction on the downtrend.
Also I am adding a possible Short Position that I might take.
Please comment if you feel my analysis is wrong and much more important: NEVER INVEST ON SOMEONE ELSE'S IDEAS!
Trade safe and BTC will definetely go to 100K+ (eventualy)

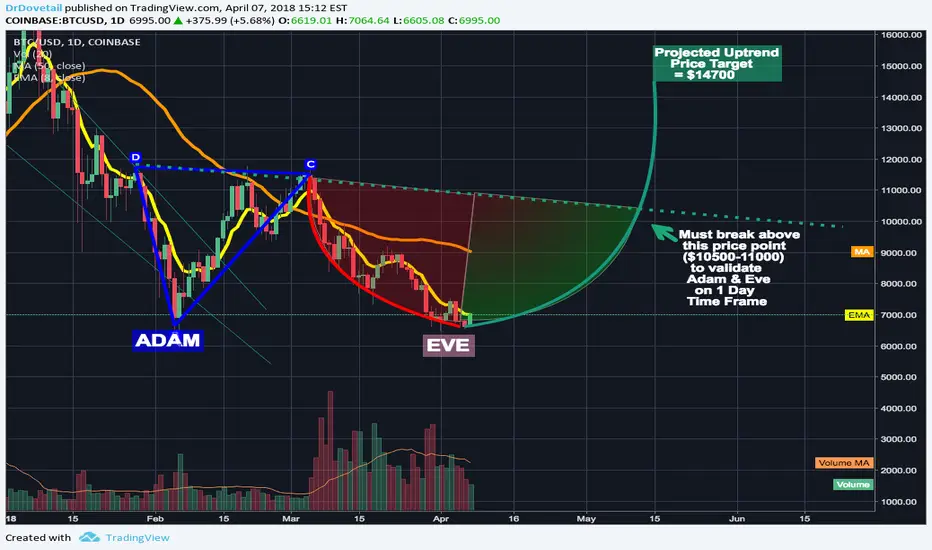
An important flashback to a previous Adam and Eve Double bottomhere we have on the 1 day chart, back on a very important day in bitcoin(September 15th, 2017), something extremely worth noting the importance of. You can see where I've circled on the volume chart the tall green bar for that day...this green bar just so happened to be the biggest bull volume swell of the entire year of 2017 and it was exactly 3 months later on December 15th that bitcoin hit it's all time high. I originally assumed that this volume bar was the main catalyst for that all time high and later after the low in February, when we received yet another huge bullish volume burst that was even somehow slightly bigger than this one, I anticipated that we may get lucky and reach a new all time high 3 months from february 6th (May 6th)....at the time I had only that to go on...until the possibilities of an Adam and Eve double bottom to lift us out of are current dip started becoming a real possibility and then I decided to look back to this september catalyst to check and low and behold we formed an adam and eve double bottom during its volume spike too...which further convinces me both that we are about to have a valid adam and eve double bottom...and an eventual bullish breakout that then eventually leads to a new All time high. This is nothing but a little bit of history repeating...so if we do complete this adam an eve double bottom I think a new all time high around may-june is entirely feasible. I haven't heard anyone else yet say they spotted this so I wanted to be the first to put this idea out there to help get others to notice it...I haven't checked the moving averages with it but it wouldnt surprise me if there was a death cross somewhere around this time frame too...I will check after I initially post this idea and if there is I will notate it in the update section. Cheers!

What hints to expect if the Adam & Eve Double Bottom is ValideHi all just wanted to gie you an idea of what to watch for if this bigger Adam and Eve double bottom is valid. If it is the size I'm projecting, then the bottom is likely already in at $6420 back on Easter(aka Jesus' resurrection and possibly btc's resurrection?) so far we have just established a higher low on the 4hr chart after the higher high we had of 7500 so we need now to establish one more higher high on the 4hr to give control of price action back to the bulls...we will probably form a higher low on the 1 day chart before that happens though so be on the lookout for a higher low on the 1 day as that hasn't happened yet. If we can achieve a higher high on the 4 day that will be a great sign. If the Eve bottom truly is forming the way I think it is we should also on the next retracement only go down to around 6520-6660 max before picking back upward...as you can see by the symmetrical arc I gave it (which in crypto things rarely prove to be that symmetrical but it's just a rough guideline to go by) we have reached the end of the downward motion and should start sloping upwards if so we won't be going under 6800 again after the 15th of april....and if this is correct we should be back above 10400 by may 15th but we could also easily break above that and validate the adam and eve far before that since things are never quite that symmetrical. To reach those heights by May 15th would be excellent, and when you realize that the volume spike we got on february 7th is larger than the one from last year that 3 months after it happened we got the alltime high...there's very good reason to believe that we may be able to reach another all time high some time in May. Breaking above the 10400-10500 area and closing above it by may should trigger the eve shoulder and send us upward to 14700 or so...an from there the FOMO that kicks in could easily take us above our all time high...especially with all this news of institutional investors entering the market, and people like rockefellers creating venture funds for crypto and george soros getting involved in crypto...it all hints at a very bullish turnaround very soon. So for the longterm at least I am long so this idea will be long...but in the immediate day or 2 we may drop back down to the uppers 6500s-6660 region and then by the 15th of this month i dont think you'll see us get below 6800 again. You choose your own path however as this is not financial advice. Good luck and thanks for reading!
Bitcoin: BTCUSD Saturday Update and Next Trade Points Bitcoin Saturday Update and Next Trade Points
Bitcoin went into the weekend looking like it was just a matter time before it broke lower still. All that consolidation below structure to the left of price was saying that no-one wanted Bitcoin above 6666. By 22:00 gmt this level really had taken on major significance. The number of the beast or no, it was also now the dividing line between Bitcoin staying negative and flipping back to positive.
Then at around 01:50gmt there was a massive whale attack.
And although primed for just such an event this weekend, we've never seen an attack out of far East like this for months now. It was big volume - a serious attack.
The trigger for the next long was a break above 6670. Since then Bitcoin has surged up to test the junction of the fixed and dynamic resistance lines at 6909 with an intra day high at 6917 on Bitfinex.
Now it needs to consolidate some more and is doing so by unwinding in a 100 point range with support underneath provided by the 6817 line here.
Can either close out here around 6868 for 218 points profit overnight or stay with it with a stop under 6800 for 120 or so profit if struck.
Am doing former as it's the weekend, looking to re-enter long only once 6909-6950 range is broken above, looking for a rough 400 point rally to 7266 minimum and more likely to 7431.
On downside support at 6818-6800 line must continue to hold up on retests today for Bitcoin to remain positive from here.
A break below 6800 will tip Bitcoin back into bear territory and trigger the next near term short from here if we see it, back to 6666 - where it should bounce again.
We are still stuck in the range with the weekend ahead. Unless 6950 can be broken above that looks likely to remain the case for a while longer this weekend - but with some decent near term trading opportunities ahead of us all the same.

NZD/USDFIB 50 percent retracement level outlook on both wings.
Looking for profit on the bearish reversal with the next hours or days.
Placing stop loss at outside of blue Resistance levels. Setting up sell position anywhere underneath blue resistance level.
Anyone needing help in the markets. Education. harmonic scans. Entries.
email. Iamtradeking23@gmail.com
lets work.


Bitcoin: BTCUSD Key Levels and Breaks for Sunday Trades Bitcoin Bitfinex Feed Sunday Update
The first short yesterday from 7049 was stopped out at 7061
for a 12 point loss. Bitcoin went on to make a high after that
at 7071 - a poor stop by 12 points. This is my bad here, not
the chart's - just a poorly judged spot for the stop. Sorry for
that one.
Anyway the second time it broke 7050 gave another chance to
short and this time when it next counter-rallied the high was
7038 and the short stayed good if you took it on the second
time around.
The low today is 6615 on Bitfinex.
Last gasp support today lies in an 80 point range from 6615
down to 6535.
Bitcoin should try a rally attempt from here so look to close
out shorts in this range. The next short from here triggers
once 6600 is broken, aiming for another test of 6000 with
stops 50 or more higher once broken.
On upside some day traders will reverse long down at these
levels for a test of the falling dynamic at around 6850 but it's
quite a risky trade and until that same litttle dynamic is
broken to the upside Bitcoin will remain vulnerable. The rally
we are seeing now should stop there and day traders will
likely close out longs there at around 6863. Bitcoin will have
to break above this dynamic for the rally to be worth
following higher to 7221 with stops under the dynamic when
broken above. But any potential swing longs will have to wait
for 7221 to be broken above to follow long with stops 50 or
more lower.
Until we see that happen Bitcoin remains under pressure but
cannot be shorted again from here until 6600 breaks.

Maximum Hopium? Adam & Eve Bottom + Inverted Head & Shoulders!If you're looking for bullish signals, look no further.
If completed, this adam and eve double bottom + inverted head and shoulders would signal a bottom has been found surging the volume and price skyrocketing upwards.
Hopium levels in overdrive here.
Tread the chop carefully and be patient.

bearflag expands ; are we looking at another descending wedge?For now I stay neutral because sure there's plenty of bearish signs in the market but there is also what appears to be another smaller fractal like descending wedge pattern forming as I have indicated here with the light tan trendlines...These patterns are pretty bullish and Haejin Lee also hypothesized after the last descending wedge that we would rise up and former a smaller fractal of that descending wedge which is kind of what it appears we are potentially doing...of course if this bear flag decides to break bearishly then the potential of triggering a massive head and shoulders that could send us to 5100-5400 is possible...but if we don't confirm a bearish break below this wedge we might instead see a nice bullish break upward to subvert the bearish head and shoulders....Head and shoulders can often be tricks for example the last descending wedge was hidden inside a fake head and shoulders....this could once again be the case....we are sitting at a pivotal moment of limbo where the side it breaks on will determine a big fall or rise. Be careful tread wisely and make good decisions...this is not financial advice. Lastly based on the recent two candles having a trendline that connects them we can expand the ebarflag and see that it likely hasnt been broken yet and is instead bigger than we had originally seen wich happens alot with flag patterns.

How a whale may be influencing price for fun and profitThe explanations are in the chart. PS. this is just a theory, obviously, but i wanted to share it anyway. I hope you like it.

TRX, Bullflag and Head & shoulders reversalTRX,
Entry on confirmation candle over neckline. That can spark a move to break out of the flag and continue the lenght of previous pole.
Entry 0.00000421 - 0.00000424
Stoploss 0.00000410
Target 1: 0.00000500

USDJPY BUY on D1The is a RSI Divergence on daily TF and a bullish pinbar cand was seen in the last candle.
On Daily TF a Bullish Crab Was formed and on the hourly TF a bullish bat was formed

TRX Bullflag and head & shoulders reversalMy plan for TRX.
If we break neckline of the head & shoulders reversal we are likely to break out of the flag too.
Entry: 0.00000421 - 0.00000424 ( Over neckline ) on confirmation candle.
Stoploss: 0.00000410 ( Under right shoulder )

XMRUSD MONERO LONG!!!Inverse head and shoulders forming on the 4h time frame with a break and retest of neckline occurring.
4h also reveals the formation of a higher high
On the Daily, there is bearish convergence on the RSI, signalling a trend reversal to the upside.
Price on the Daily has also rejected the 61% fibonacci previously and has done so again. This is also reinforced by the lower bound of the wedge formation, creating strong support.
Price is expected to test the higher bound of this wedge formation at which our TP will be set
Entry:$214
TP: $320
SL:$178

IOTA - MIOTA Cup of TeaA possible Cup and Handle pattern is forming on the 1H timeframe IOTA.
(This is not financial advice, this is a volatile market where anything can happen)
Ascending wedge drop target dropped to the exact length of wedgeJust wanted to show you all how the purple ascending wedge once it was broken out of dipped the exact height and angle of the wedge...so a very reliable pattern. Also wanted to note that we now have 2 4 hour candles that have closed below this head and shoulder neckline with the bulls desperately trying to lift it back up above the neckline...so far on the 1 day chart though we have yet to close below the neckline...I wouldn't consider it a definite breakout until I see 2 1 day back to abck candles close below the neckline...but with 2 closing below it on the 4 hour its definitely not a good sign. Hoping for a false breakout because if it is a valid breakout you can see by the red dotted trendline that it would take us all the way down to the red fib retracement level....which would be lower than both the grey ascending trendline which has acted as extremely strong support multiple times since last July and would take us even further down than the bottom we hit in February. So if you see today's 1 day candle close under the neckline be prepared to play the short game waiting on 1 more 1 day candle for confirmation. If the bulls can find a way to get the 1 day to close above the neckline...then there's still a slight chance for a ltitle more downside possibly finding good support at the ascending grey trendline or if it breaks below that at the same price we found februarys bottom at.....Once we find a clear bottom that is likely the time I will go fishing for extreme bargains in the alt coin market, but the way this head and shoulders is looking right now, there's a chance we could dip into the $4,000s before then. I certainly hope not but if so I intend to find a way to allow the dip to make more more btc in the process. You make your own decisions however as this once again is not financial advice. Best of luck.

BTC hits ascending wedge drop target, flirting w/ h&s breakdownBTC has just reached the target price drop of the ascending wedge breakdown shown by the purple dashed line. WWhile it doesn't surprise me it hit this price, it does worry me, because now we are in real danger of breaking below the neckline of this current head and shoulders..we have already sent a wick below it. In order to break it we will need at least 2 closes below the neckline on the 4 hour chart. Even then its not a guarantee that its not a fake breakout but the probability and odds are then at that point greatly in favor of a successful breakout. However 2 closes on the 1 day chart under the head and shoulders neckline will indeed signal a valid head and shoulders pattern. If this happens we may possibly plummet below my grey ascending trendline and possibly dip even lower than februarys low which is a very scary thought. So these next few candles are clutch. I'm still hoping we will eventually find strong support and a huge bounce back up from either the grey ascending trendline or just under it at the same price as februarys low thereby creating a massive double bottom pattern. The latter would probably be preferable, as it would have greater potential to take the price far higher. Anyways be careful out there if you aren't already still short, and you see 2 confirmation candles below the hea and shoulder neckline it may be wise to go short at least until right above the grey ascending trendline or possibly right above it if you are fishing to trigger a limit with a wick. A more adventurous trader may try to put their limit buy back in just above the low of february. As of right now technically the inverted head and shoulders pattern is also still in play because we haven't gone below its head but I have taken it off the chart currewntly as to not muddy up things with overlapping h&s patterns.
