Litecoin: LTCUSD Far Eastern Interest Returning / DominatingLitecoin: LTCUSD Far Eastern Interest Returns
Timings on LTC show strong far East interest re-emerging.
That surge of green on 14th began at midnight gmt/19:00est
just before markets opened up as early birds caught the worm
and price began to fly high through two lines of old resistance
before topping out at the 233 line, at 21:00est just 30 or so
minutes after far Eastern markets had all opened are strong
clues. These markets are still in overall control of this coin
and their returning interest has to be good for LTC longer
term.
But in shorter term Litecoin is unwinding an overbought
condition by trading sideways in the range dominated by
resistance at 233-237 at the top and two lines of support at
215 and 207 at the bottom of the range. But very nearterm
support lies at 223 which must hold if it's to avoid rinsing off
back to 216-215 during the course of the day if buying interest
continues to wane - and may get forced back to 207-206 at
worst if 215 in turn gives way later today - but if so look to
add as these levels are touched in the quiet period leading up
to midnight gmt/19:00est. Alternatively, should these lower
levels not get touched and LTC can hold up all day at 223 and
above it can be bought on a successful breach of the little
dynamic resistance line running above price on this chart with
stops below the same line, just under 223 if the break occurs
sooner than midnight gmt/19:00est.
AND

New trader set-type using order flow long position Mo/W/D GSPUSDHave indicatios and a bias to believe that there are opportunities for the GBPUSD to go long for the Mo/W/D timeframes as trend momentum downwards has been broken, and overall Mo is up. Using the trading methodology from my mentor we can utilize a set and forget type of trade of the order flow method, since upward monthly trend is currently upward.


EURUSD and DXY confirming signal of change in trend for dollarEURUSD EURUSD and DXY
EUR is tracking an inverse set of parallels to DXY. When EUR
breaks lower it's a second sell/add shorts signal which must be
confirmed by DXY breaking above the upper parallel
containing this impulse wave from inception.
DXY has to break and hold above that parallel before the
bears will back off - but it's fighting here, where it should if
it's to turn back up from here. The confirming signal is the
break above the upper parallel.
DXY Dollar Index
Despite the spike and noise surrounding CPI numbers
yesterday DXY has been forced back down the same small
parallels it was travelling down before the numbers hit the
newsfeeds. As in last comment Dollar bulls still have the
double bottom on their side here. The last one was one week
apart, this one is 2 weeks apart. The Dollar is likely to hold
here at these lower levels and then begin to rally. It's waiting
on Wall St to open now but bears in London have failed to
push it below the double bottom. A sign of waning downside
momentum. Once it can break above the upper small parallel
guiding the descent it should attract more buyers and move
back up to test the 89.37 line where it will likely meet
resistance again...it has to push on through here during the
course of today for the bulls to gain more traction and flip
DXY into more positive mode from this point. This battle may
take some time to resolve - DXY has to fight its way through
three lines of near term resistance at 89.37, 89.51 and then
89.62 to turn back to positive again. Look to buy dips here
and on the pairs with stops under 88.40 on DXY for small loss
if wrong from here. Increase longs on move above the smaller
upper parallel.
On downside, DXY will have to break below 88.40 today to
change this view to near term negative but only back to 87.70
at lowest where DXY should find final support and begin to
rally again. But so long as 88.40 holds up today the Dollar's
downtrend is finally coming to an end.

BTC Blows up outta the inverted h&s pttern brking the neckline! The neckline has been breached in big fashion! However not as much volume as you would anticipate to go with it....that may very well come today. it has blasted past all recent lines of resistance and now seems to be forming it's new resistance line with the green fibonacci retracement line. We may most likely see it bounce back down and see the inverted head and shoulder neck line as the current support at which point I say is the best opportunity to buy in and enjoy being back on the impending bull trend to come. I'd do any selling just below the green fib line and any buying near the thin grey head and shoulder neck line! Bring on Pamplona!!!

FTSE 100: UK100 Key levels and Trade Set-ups todayFTSE 100 UK 100GBP Key Levels and Trade set-ups today
This chart shows FTSE's great 9 year rally from start point at the lows of 2009 to the end point on 11.01.18. This cycle
forms part a longer 9 year year cycle that was described and shown in last FTSE comment. The lines of support and
resistance are clear and should be helpful in coming trades...
FTSE has bounced excatly where it should have (last comment) and rallied to exactly where it should have within 3
points or so. Day traders and bottom fishers have closed out where you'd expect looking at the lines and now left FTSE
vulnerable to further selling pressure...looks quite likely to restest the 7085 line here and if this cannot hold it will fall
away further still to 6904 and just under to 6870 - but it should try to put up a fight at 7085 if tested later - it's most
likely the key level today, being positive above here and negative below.
On upside it has to break above 7210 and hold to trigger a long up to 7294.
Markets are due to remain voolatile - A break below/above any blue line should lead to a test of the next one. But run
stops around 30 points higher/lower than the trigger levels and trail up/down. Still expect a bottom to be reached
between 3rd and 10th March as per last comment but it can whipsaw in between and should present some decent
trades (with stops) as a result.

Inverse Head and shoulder pattern has formed! Watch 4 the break.On the 4 hour chart we can see a clear inverted head and shoulders pattern has formed...it needs to go above the thinner grey line to break the neck line in order to be valid, but even then, we need bullish confluence in every key indicator (rsi, stoch, mac d and especially Volume) to validate the pattern. To break the grey neckline we will need to get above 9,000 and close the 4hour candle there. Currently the depth chart on gdax suggests that the sell wall will engulf the buy wall just before it hits 9,000 and send it back down as far as 7900-8100, however it may be able to still shoot back up again before the 4 hour candle closes to over 9,000 breaking the trendline and validating the pattern...even if it doesn't break the trendline on this candle, keep in mind that sometimes head and shoulder patterns will retest the trendline, so I think it's very possible we will see it break the nackline within the next 3 days. I plan on waiting until the depth chart dumps and getting some more bitcoin then to take full advantage once it breaks the trendline. If I don't see the volume to go with the pattern once it does break then I will amke sure to safeguard myself with appropriate stop losses. A special thank you to all those so far who have read, and liked my ideas. Thanks to you, I have finally reached the coveted 50 reputation points needed to be able to communicate on other traders idea pages haha. I'm still fairly new here to this space so thanks again for your time...and always this is only what I plan to do and not financial advice....you do you.


Amazon....I never Knew!
Nice big ol Divergence ready for that nice rubberband man, Wild as the taliban type lift off!

FTSE 100 Index: UKX - Cycle High - Short Set-Ups with triggersFTSE 100 Index: UKX Long Term Time Cycles in FTSE Index
After rising 10% at the start of the 2018 FTSE has fallen all the way
back its start point for the year. Up 10% and back down 10% in 6 short weeks. The action looks unlikely to stop now.
In fact it could be just beginning. Probably the greatest trader who ever lived, WD 0.61% Gann , told us to measure
time cycles from high tolow and low to high as well as high to high and low to low and look for potential changes in
trend as these hiddden cyclesrepeat themselves down through time. Previous cycle highs identified the exact date of
the high in 2007 as well as thesubsequent high reached in April 2015 just at the point thatmarkets began a 10 month
20+% correction (for more detailsplease PM) . This cycle marks the period from 10.03.09 majorcrash low through to
the next major cycle low on 06.03.09. From major cycle low to low is 9 years ...which now brings us,
after a 9 year long bull run, to the coming 23 to 27 days,culminating in the anniversary dates between 3rd march and
10th March 2018...
FTSE is already teetering on the brink of critical support at 7092. It has to cling on here on Monday for any failure will tip
this index into bearish territory and trigger a short back to 6868 at least - and then if this level in turn gives way back to
6680-6637. Beneath here the next major support potential lies at the lower parallel and below here at 5777.
So if 7090 gives way on Monday by more than 10 points look to short this index with stops above 7099, targeting 6870
initially, then the 6680-6637 range if 6860 fails to hold during Monday. It's quite probable that should 7090 fail come Monday,
this Index will fall away in stages to test the lower parallel at 6004 on around 5th March - and only then bounce away to the
upside again.This will present some wonderful shorting opportunities along the descent. However, in the very near
term it's likely that contrarian traders will look to go long here, simply because the stop is so close (20 points away
maximum now) but ready to reverse short as above if 7090gives way by more than 10 points. Time, as always, tells.

ALPHABET: GOOG Volatility = OpportunityAlphabet: GOOG Curious Case of the Unfilled Gap
Normally when Google beats earnings expectaions it tends to gap up and away for a couple of months or more and then,
eventually, momentum begins to wane and it comes back off to fill the gap. It's been that way for so many quarters now
and every gap has always been filled in the end - and notice when it does get filled that moment (that day, not minute as
with Bitcoin) presents the best buying opportunity you will find...every time....because it tells you in advance where the
low should be. Helpful if you're looking to build a long position in any FANG. Works every time. Except once. That red arrow
at 900 shows the one large gap here into new high ground that has never been filled. Friday's price action has led to a second
test of the last gap created during last earnings season. For those with a technical interest there is also a fabulous island
reversal showing at the very top of the rally with a tiny gap created to left of the red arrrow at 1160 followed by the
massive fracture which begins from the same level. The ensuing bear rampage takes price all the way back to that
same gap zone before it bounces again. Mind the Gaps. They are very interesting from a technical perspective and create
some great short term trading opportunities on the rare occasions when a stock like GOOG runs into a consolidation phase.
Having bounced from the gap zone GOOG has rallied to test the underside of the structure to its left at 1046-1050 and
come to a temporary halt at 1037. Nasdaq is likely to remain volatile next week, the environment we need to go out scalping
Maybe Goog can still make a getaway from the gap zone, just as it has always done in the recent past (bar1) - but if so it
still looks like it will need a retest to prove it. Whilst unable to move and hold up above 1046-1050 it's likely to retest
996-987 again. And if at any point on Monday 987 gives way it can be shorted back to 961. Then if this level in turn fails it
can be shortred a second (or third) time to 942 and most likely back to the lower parallels where it becomes a buy
again if struck with stops below for those who may have been waiting to buy Alphabet for the longer term. A 20% decline
would create a target at 948 and 21% at 937.
On the upside Goog has to move above 1050 and then hold up at 1037 on any retest to trigger a long but only if it holds up
well at 1037 and then moves up through 1050 with some volume behind it - then it can be followed up to 1080 but run
a stop up underneath it quite tight just in case it fails. The next near term long shot from here triggers from 1085 to 1120
and then from 1125 to the top of the gap at 1159.
As to the case of the unfilled gap...to fill the missing gap the parallel will have to be broken. Google likes to fill big gaps.
It's in its nature. It could happen eventually and if it breaks below 987 come Mondaythat will be the first signal that either
the parallel or the gap itself will become the final low. More as this move develops.

S&P 500 Index SPX Next Buy and Sell Points TodayS&P 500 Index SPX Next Buy and Sell Points Today
A poor call on this index yesterday led to the loss of some 12 -15 points as the buy point at 2627 was broken and the stop at
2614 triggered. It wiped out the 6 point win earlier but at least the 60 point win on the short on Moday and the next 60
points or so from the long on Tuesday means the point tally for the week is still positive, if a little depleted.
Yesterday's price action has driven the S&P to a new closing low, taking it back to fill the little gap that shows on this
chart at 2584. A 10% move from the top = 2585, the low yesterday was 2580. So long as this low holds out today on any
retest this corrrection remains a standard deviation - but the low at 2580 must stick now for the medium term trend to stay
positive from here - any fall below 2580 by more than 4 points will tip this index back into bear territory and force it lower
to 2543 (first short) and then if this level breaks to 2488 (second short).
On the upside, whilst stuck within the range and below 2619 it's not giving a strong enough signal to trigger a trade...it has
to break above here and hold there to trigger a rally to 2668 which should be worth following with stops just under 2600.
Alternatively can be bought at 2607 current levels with stops below 2600 and added to once 2619 is broken above.
This is higher risk but also higher reward. Others will prefer to wait for next signal to trigger before entering positions.

Giant Colossus: Head and Shoulders PatternGigantic Head and Shoulders pattern forming. Prepare for destruction down to 4k.

S&P 500 Index: SPX Next Buy and Sell Points TodayS&P 500 Index Update Next buy and Sell Points
Yesterday the S&P fell 5 points shy of the next target, busting
out the next long as support and stops just under the 2715
break line were hit and so turning a 12 point profit into a 2
or 3 point loss. Not so good.
It looks as if it will fall further now to retest 2669 and maybe
spike as low as 2661 level but should bounce from there at
lowest if it is to show stabilty today.
if wrong and this 2661 level fails to hold up later it will likely fall
away further to 2626-2600 range where it becomes a buy
again with stops below 2590.
So far this decline remains a standard correction or deviation
of 10% - 10% off the top = 2584, the low was 2592 - and it can
at worst fall 11% to 2555 but no lower if this is to remain a
'standard' correction. Should this level fail at any point this
week it will tip this index into serious bear territory - the
decline will then likely extend to 2584, then to 2545 and then
to 2488 where would look to buy once more if this kind of
price action unfolds from here. Don't think it will so far, but
we still need a plan B here, just in case.

Bitcoin: BTCUSD Next Buy and Sell Points todayBitcoin BTCUSD Update Next Buy and Sell Points
We left this overnight waiting for the 4th break lower to hopefully develop a double bottom to show loss of downside
momentum and looking for the rally to recommence from there. Interestingly - for some at least - the low was actually
also the tiniest of gaps which was created (green arrow) on exit of the last smaller continuation pattern from the night
before last - so small...but it got filled precisiely. So the tiniest of gaps was not 'forgotten' - Bitcoin came back and
painstakingly filled that gap, and then with the crack in the wall filled, it moved on up again. Where this kind of
behaviour is quite normal in a major market index like the Dow (which closes each day to create gaps) it is highly
unusual in Bitcoin (it never closes, so why should there ever be a gap?) But the gap is there, small but clearly. And
Bitcoin just had to fill it.
Since then it has rallied 800 points back to test 8332 resistance line and is once more consolidating. Price action is
quite subdued though - it did get bought in London again but not aggressively. So now it's coming back towards the dynamic
in a three or four-wave move most likely which can be bought again if not long again already on exit of the upper small
parallel for rally back to 8332-8350 and then, once passed, to 8550-8650 range. Bitcoin has to break above 8650 for the next
part of the rally to take shape and to follow for higher prices still ahead.
On the downside the dynamic running under the lows overnight must hold up to all challenges from here. Any
failure will be the first big hint today that upward momentum is waning here- not much buying intent so far...so this is not
not particularly strong yet, but also the decline overnight was not a collapse as it could have been - so it's pretty neutral
right now but still with an upward bias. However should the rising dynamic under price fail today at
any point look for the same type of pattern emerging as yesterday when it lost the parallel then...a rally back to
underside of the same line and then, eventually, failure. If we see this type of price action develop it can be shorted with
stops above the line. But until then we can look to buy this next next dip to the dynamic with stops under the line.

ETHEREUM: ETHUSD Next Buy and Sell Points TodayETHEREUM ETHUSD Update
So maybe you have 5% more ETH for your money than
yesterday...and if not ETH is back at the same levels again,
but this time challenging resistance from the underside of the
dynamic which until yesterday had been good support...so
we've seen this pattern countless times before...ETH is
vulnerable again here - must find buyers now to push above
848 and hold there for further near term strength today to
892 and then 990.

Nasdaq 100 Index: NAS100 Next Buy and Sell PointsNadaq 100 Index: NAS100 Next Buy and Sell Points
The last 3 declines on Nasadq were 339, 357 and 345 points.
This one is now 354 points, so far - par for the course.
Nasdaq is now flipping within the boundaries of the two fixed
lines of support at 6696 (spiking below here by 20
points to 6676) and resistance at 6786 (spiking above here by
19 points to 6807). It's therefore near term neutral whilst
within this range.
It has to fall below 6670 to trigger a short back to 6614. This
level must hold up throughout this week. Any failure here will
trigger a second short back to 6371 minimum and more likely
to the 6231-6192 range. On the upside a move and hold above
6810 is needed to trigger a long to 6876-6890 where will look
to close out if touched and then maybe reverse short with
stops above 6910.
So far this is a short, fast decline which matches the size of
the last 3 - but the shape of this one doesn't suggest
continuation as the others did. It's too sharp, suggesting it
may well have further downside to run. Breaking lower to
6614 will become the biggest decline for 2 years - and signal
that once broken the Nasdaq will test 6371 before it becomes
a buy again from here.

BTCUSD BULLISH Head Shoulders Knees and Toes patternSo for the traders among us that were children in the past, there is this song which goes:
Head, shoulders, knees and toes, knees and toes <---
Head, shoulders, knees and toes, knees and toes
And eyes and ears and mouth and nose
Head, shoulders, knees and toes, knees and toes
So naturally, we should see a head shoulders pattern again

Gold and DXY: Correlation Shows first signs of breakingGold and DXY
Recently gold has been very closely correlated with moves in DXY, but up to 3 times more volatile, moving up to 1.5% for
each .5% move in DXY - but not today. Gold is showing up on the day to day, only marginally, but until last week changed
things it would have most likely been down 1 to 1.5% today on back of DXY strength.
Last week's FOMC meeting left markets with the anticipated and forewarned sting in the tail (see TNX forecast) risk/reward
ratios are already way out of kilter and and now with a steady rise in interest
rates towards 'normalisation' in the 4-6% range - which will likely be faster than markets currently expect if wage
inflation starts to push beyond 5% - all mean that gold's not so bearish any more just beacuse the dollar's bullish.
Suddenly, there are are other factors in play, helping gold to weather DXY strength. This interplay between gold and DXY,
which has been so clear for so long now, has reached it's peak and this trade is over for now, done.
Cannot get bearish of gold unless it breaks below the small dynamic support underpinning price now for fall back to
1327-1325 range . And then, irrespective of the dollar from here on in, it has to break 1325 to trigger the next short back
to 1306. Looks as if today's price action is the first for while to see gold decouple from DXY - the reason is the hawkish tone
coming from the FED - (and subtext is inflationary wage rises, the biggest threat to inflation of all) - gold is being viewed a
little differently today than it was last week. It is the start of a new trend. Day 1. Follow the curve. Yellen is/was already
behind it, leaving Jerome Powell to clean up after her.
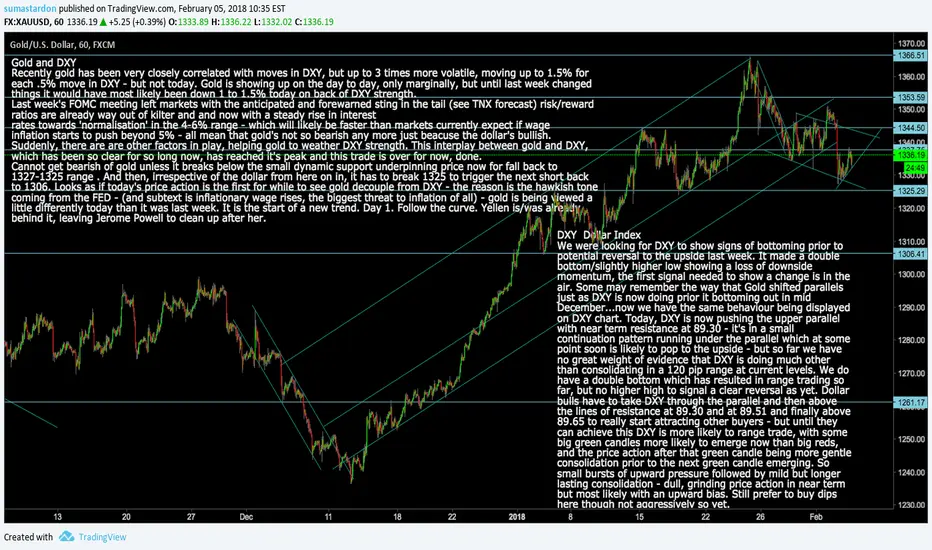
Bitcoin: BTCUSD Next Buy and Sell Points TodayBitcoin BTCUSD Next Buy and Sell Points Today
We left Bitcoin overnight to track the parallels lower to the
next downside target at 8300 on Coinbase chart. The low so
far is 8310. Close but no cigar.
Bitcoin is still under pressure whilst unable to break above the
dynamic which has clipped all rally attempts overnight -
cannot be bought unless it breaks above this dynamic and
regains 8610 and holds there - only if we see this price action
develop can we go long for 9093 and a test of the upper larger
parallel where will look to close and maybe reverse short
again at that point if touched.
But until we see that the selling pressure remains. It has to
hold now at 8300 or we have another poor day about to
unfold. Some day traders will buy here around 8310 but with
stops close under 8300 and ready to reverse for small loss if
wrong if 8300 is broken now. On the downside the next short
kicks in on a break below 8300 . There's minor support at 8150
which may create a little bounce but the next support any
significance below 8150 is at 7830 on Coinbase, then 7500 and
finally 5656.
A break below any of these levels by more than 30 points or
so should lead to a test of the next level

Bitcoin: BTCUSD Update and next key buy/sell points
Bitcoin BTCUSD Next key Buy and Sell Points
Bitcoin is again trying to build a base from a new near term
low established at 9515 on Bitstamp feed. It's made a right
shoulder at 9912 support line since then and is trying hard to
rally but finding resistance from the old parallel above it
which had acted as support earlier on in this decline. It fell
2500 points or 21%, as standard decline for most major
indexes in a major consolidation.
Usually, after such a large decline Bitcoin often forms a V
bottom as hungry buyers chase it back higher again. This is
not the case today. Bitcoin cannot recover from here unless
10262 blue line is retaken and held by the bulls - only then
will we look to go long again with stops 50 or so lower looking
for 10547-10576 range initially and then the next level at the
10772 line to close out again. Day traders will likely close out
at 10547 creating a wave of profit taking, looking to buy back
150 to 200 lower.
On downside bears are still selling off that old parallel above
price now and Bitcoin remains vulnerable whilst unable to
regain 10262 level. To trigger the next short from
here we need to see 9912-9900 broken but even then Bitcoin
will look for support at 9750 line so this will only offer a quick
short scalp in all likellihood. To turn outright bearish again
now Bitcoin now has to bust below 9500 in which event it can
be shorted again back to 9371 at least and likely to 9210-9200
where will look to reverse if struck with stops 50 or so lower.
Short positions yesterday and overnight yielded around 860 points of profit to begin with but the final short from 9750
failed to reach the target and resulted in a 50 point plus loss, so just under 800 points or 8% in scalps. So long as Bitcoin
keeps moving up and down we can make points. So long as half the world thinks it could be worth $50,000 and the other
thinks it's worth $5 we have a big range to trade within. The biggest range in the history of speculation/investment. We
don't need to even believe in Bitcoin or disbelieve either. We just need to follow the signals off the chart and try to follow
them as best we can. Usuually the chart signals tend to work quite well with Bitcoin and produce large gains - and when
they don't, as with the last short overnight, they produce smallish losses. And if you subtract those losses from the gains
made over 3 months of intensive trading (resumed the hunt for Bitcoin in earnest on November 3, 2017) you'll find just shy
of 27,000 points have been scalped from Bitcoin in that period. This was only possible because Bitcoin has moved both
up and down so much in that time. Why seek to own a Bitcoin if it might only be worth $5 at the end of the day? Because it
might also be worth $50k at the end of the day. Who knows, do you? Let others decide its true worth and in the meantime
we can trade both sides of the argument until the day when arguing stops.

