Ankr


ANKRUSDT analysisIf the chart breaks resistance after confirmation, we can buy. Then we need to watch for engineering robo signals for sell2,sell3 or hell signals.

ANKRUSDT AnalysisPeople who listened EngineeringRobo's BULL signal on April and bought ANKR, enjoy your 775.83% PROFIT that you made in 4 months!
There's also MOON, Super Buy & Green Cloud follows right after BULL signal.
So, if you bought ANKR, do not hurry to sell since there are 4 BUY signals present.
But, there is a candle open closed (1D) below the resistance level (0.016), so you can take a profit if you want to or you can wait for EngineeringRobo's sell signals to sell.
Also, if you want you buy, you can wait for resistance level (0.016) to turn into support level & I'd recommend you to keep an eye on EngineeringRobo's sell signals after you buy.


ANKRBTC | Price Nearing its resistanceBINANCE:ANKRBTC has conquored all its major EMA's(100D-blue, 200D-red, 300D-yellow). Depending on how the price pays on reaching a resistance plays an important role in going long.
BUY: 0.00000043 - 0.00000047
T1: 0.00000054
T2: 0.00000060
T3: 0.00000065
SL: 0.00000027 (Below the 300D EMA)
Thank you for reading hope you have a great day!!

ANKRUSDT ANALYSİSI have 3 positive signals I also saw Buy3 signals at the new support line ($ 0,006882) ıt means big hope for getting more profit.
If you bought this coin with moon or bull signal in May enjoy your 5x profit
Buy at the new support line($ 0,006882) sell with EngineeringRobo' s second sell signals(hell or bear)
Have a good trade. If you want to use EngineeringRobo please dm me.

ANKRUSDT AnalysisIn my opinion, it is not a good time to buy ANKR. In fact, Engineering Robo 2 is giving a Sell 2 signal, indicating that it is time to sell it for those who already bought it. In addition, the candles have moved down and there is an open-close candle below the 0.005 resistance level, indicating that it is a time to sell it. If the candles go back up, and there is an open-close candle above the 0.05 level, it can be a good time to buy it again, but it is better to watch for Engineering Robo's buy signal.

ANKRUSDT ANALYSISBased on my analysis, if you wanna buy ANKR, this time looks like a good time because the candles are above the support line(0.005807). However, if you wanna be sure, you may wait a little more and when the candles start to go up, you will buy it.
After buying, you watch EngineeringRobo's sell signals and/or you will sell at the resistance line(0.011840)

ANKR - Perfect cup and handle formationAnkr has printed a great cup and handle formation on the daily and looks to be close to the bottom of the handle.
Expecting a 50 - 100% rise from here over the next few months.


ANKR BTCANKRBTC - i love this coin. it will probably just go parabolic. however, we cant fomo in to it. I already took profits so.... here are my re-entry ideas. hoping for just a bounce in the rising wedge, before a parabolic move higher.

Onwards and Upwards Cant promise if you can get an entry on this but if this retests then this is getting sent!
ANKR bullish pattern next 30% profit run.ANKR forminh ascending triangle that is a bullish pattern.
Buy 0.00071
Stop 0.0063

ANKR/BTC in a strong uptrend... Take profits while you canUsing Fib extension to determine the next area of resistance for this uptrend... The 1W timeframe gives a pretty clear idea where we are headed...
Current price 0.00000046
Next major resistance point at 1.618 (0.00000060)
Other bullish indicators used to confirm this trend:
MACD: Currently showing bullish and rising...
ADX: currently above 20, and rising... which indicates an increasing strength in the uptrend
You can ride this and take profits... If you havent bought earlier. You can buy in now, and sell at 0.00000060
Like this idea, and follow me. Thanks for your support!

ANKR trade ideaHello, traders,
ANKR is testing an important support level and the bulls are showing straight next to this important support level, and the price still has a wave 5 to go.
Until we are above the short term uptrend line we are bullish on this asset.
Push the like button and follow us on tradingview.

Ankr Network Full Chart AnalysisToday, Ankr Network (ANKRBTC) hit the mid-February high/peak, there is room for more.
Here we have a potential double top forming but also a bullish ascending channel.
Strong resistance is being faced right now and 40 satoshis (0.00000040) is the next challenge.
If this level is conquered, prices moving, and closing above it, we can easily see additional growth (zoom out for more targets).
But if ANKRBTC fails to conquer this level, we will see a drop like last time (red arrow).
Seeing how all the other altcoins are doing, there is good potential to see more up. This is a tricky spot though, make sure to have a plan (and very tight stop-loss) before you trade.
This is not financial advice.
Thanks a lot for your support.
Namaste.
Previous chart | Perfect hit May 5th

ANKR/BTC Looks Good As per Chart I can Expect 80% Potential ANKR/BTC Now looks Bullish Flag at this Time.
So now At Strong support of Bullish Flag so I am buying here.
I am trying to buy 17 Satoshi.
if Breakout upward then My Target Would be 26 satoshi and 32 Satoshi.
Support : 16 Satoshi
Resistance: 26/32 Satoshi
Stop loss 16 Satoshi
Guys Always put stop loss for safe your fund.
Guys please Click LIKE Button for Appreciate me.
Thank you so much Guys for your love.

ANKR/BTC Now 120% Profit guys take profitANKR/ BTC Chart Profit Booked Analysis:
ANKR/ BTC Trading at 35 Satoshi and our entry was 15 Satoshi and 22 Satoshi also.
Total 120% Up from our Entry.
Guys Now you can take profit and enjoy the ride.
Support : 30/26/20 Satoshi
Resistance: 48 Satoshi
Guys please Click LIKE Button for Appreciate me.
Thank you so much Guys for your love


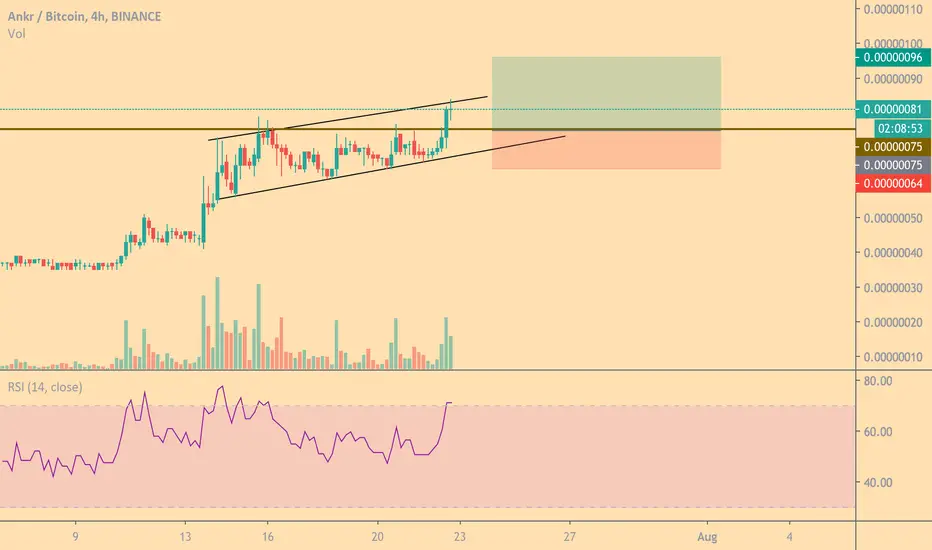
Watch Ankr/BitcoinWatch Ankr/Bitcoin for potential Trendline Retest and Long Trade.
Disclaimer:
We are not registered or licensed in any jurisdiction whatsoever to provide investing advice or anything of an advisory or consultancy nature,
and are therefore are unqualified to give investment recommendations.
Always do your own research and consult with a licensed investment professional before investing.
This communication is never to be used as the basis of making investment decisions, and it is for entertainment purposes only.

#ANKR BTC Prepare to explodeAbout #Ankr
Ankr Network aims to establish a more open cloud ecosystem by building a distributed computing platform that could leverage idle computing resources in an efficient marketplace. Noting high margins earned by tech giants involved in the cloud computing industry, the team behind Ankr Network believes there should be a way for researchers, students and startups to access affordable cloud computing in a way that is not centralized.
Buy when the price breaks through the resistance
