#ANKR New Trade [May, 6th]I open a new trade on ANKR,
This is a for Personal record and not a Financial Advice.
Setup on the Chart.
Ankr

Ankr Network Will JumpThe same chart we draw recently is still valid and fully playing out... Ankr Network will jump.
Here we have the chart for ANKRBTC with massive bullishness taking form.
First we have a break of all minor EMAs (EMA10/50/100).
MA200 is being challenged as well.
Trading volume is going up (high volume ).
The MACD is showing a bullish cross.
The RSI is really strong.
What follows after these signals on this bullish setup is additional growth.
If prices drop and close below 0.00000017, the above chart analysis becomes invalid and a new one is needed.
Thanks a lot for reading.
Namaste.
---
Previous chart

Ankr Network Challenging MA200, Can Easily Grow 70%+ NextAnkr Network (ANKRBTC) is now challenging MA200, which is sitting at 23 satoshis (0.00000023).
If this level can be conquered, we can expect additional with 70%+ being an easy target.
If prices go lower and close below EMA10/EMA50, we look at 0.00000019 as our main support.
Below EMA10/50 we go bearish, above MA200 we go strong bullish.
Additional details can be found on the chart.
This is not financial advice.
Namaste.

Ankr Network Continues | Chart Fully Mapped (Only The Beginning)We've been tracking and trading ANKRBTC with great success... The chart looks full bullish, let's take a closer look.
Prices are trading above EMA10 and MA200, meaning that the bulls are in control.
If prices move and CLOSE below these levels, we switch our view from bullish to bearish.
Above MA200, ANKRBTC can easily continue to grow (1).
But if prices move lower (2), there can be a retrace before the uptrend (3) is resumed.
We are bullish here and with the rest of the altcoins market... This is only the beginning, this new bullish wave will produce amazing gains... We will enjoy great results.
Namaste.

Ankr Network Moves Back Above MA200 | Easy 50%, 115%+ PossibleAnkr Network (ANKRBTC) is now trading back above MA200 or 25 satoshis (0.00000025)... This is a bullish development.
After a strong bullish wave that started in late Jan., ANKRBTC started to retrace.
EMA10, EMA50, EMA100, and MA200 all were conquered and then tested as support.
Now that these levels have been confirmed as strong support, the growth can resume.
If ANKRBTC closes above 0.00000025 (MA200) with good strength and volume, we can expect additional growth (green arrow).
If prices move below this level, we can expect some retrace before the next move (red arrow)...
This is all for now.
The targets are marked on the chart.
Thanks a lot for your continued support.
Namaste.


Ankr Network Bullish Divergence | Short-Term AnalysisHere we are looking at Ankr Network (ANKRBTC) on the 4H timeframe to map the next short-term move...
Looking at the signals, we have strong bullish divergence showing up with both the MACD and RSI. This is marked on the chart with a blue line.
Prices for ANKRBTC are also moving above EMA10 and EMA50 while finding resistance at 15 satoshis or EMA100 (purple line).
If 15 satoshis can be conquered, we are likely to see ANKRBTC move higher.
13 satoshis is the main support if prices move lower.
What happens next we let for the market decide. More trading volume is needed to confirm this setup as bullish, but the early signals are now in and Ankr Network might move next.
Thanks a lot for reading.
Namaste.

Ankr Moving As Expected | Easy 95%, 140%+ Within 1-2 WeeksWe looked at ANKRBTC (Ankr Network) recently and its price is moving just as we expected.
Right now EMA50 (now magenta) has already been conquered, the next barrier is EMA100 at 0.00000021.
I am making charting easy for you...
Above 0.00000021 (EMA100), we get impulse move/strong fast growth.
Below EMA100 prices will retrace and consolidate until another try at EMA100 happens. We remain bullish always expecting a bounce if prices drop.
ANKRBTC Chart Signals
EMA10/50 Bullish cross.
Bullish MACD and RSI.
Above-average volume and going higher.
Market sentiment 100% bullish.
I hope you found this analysis entertaining.
Namaste.
Previous chart | Jan. 31 | Ankr Network Bullish Divergence | Short-Term Analysis

ANKR/BTC | 70-80% Profit Potential..!!ANKR/BTC
Forming Falling Wedge & Printing Bullish Divergence As well in Bigger TF Chart.
In Case of Breakout, It Might Test 40 Sats..(Need Patience)
EMA21 is First Major Resistance.!!
Buy Zone 22-24 Sats
Sell Targets 28-32-36-40 Sats
Hold Time : 15-28 Days
Please, give us your opinion in the comments.!!
If you like the idea, please hit the Like button and subscribe to the profile in order not to miss our updates.
The information given is never financial advice. Always do your own research.

ANKRBTC hits resistance of wedge | Upto 23% short opportunityThe priceline of Ankr / Bitcoin is moving within a falling wedge and has hit the wedge's resistance and also 100 simple moving average resistance and likely to fail in breakout.
MACD turned weak bullish from strong bullish soon it will be turned strong bearish.
Stochastic has given bear cross.
We can buy back from the support of wedge however I will post a buy back plan soon insha Allah.
Regards,
Atif Akbar (moon333)


ANKR BullishNo more tokens being released for three years, high buy volume, bullish divergence, ICO price 0.0066USD


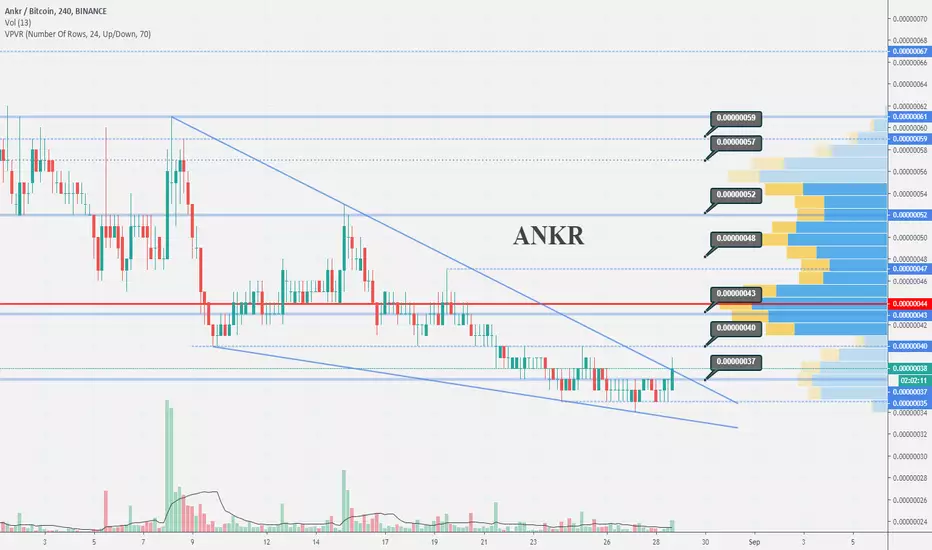
[ANRKBTC](70%) Ankr Trade Signal @alanmastersHere we are seeing a clear break of the "major trendline" for Ankr (ANKRBTC).
I promised to share a trade for you all once this one started to move. There is a good chance here for additional bullish action.
Below you can find the trade details, remember to like and comment...
-----------------------
PAIR: Ankr (ANKRBTC)
ENTRY: 33-35 (34)
TARGET:
(1) 39
(2) 43
(3) 46
(4) 51
(5) 54
(6) 58
PROFITS POTENTIAL: 70%
STOP: Close weekly below 27.
-----------------------
Thanks a lot for your continued support.
Namaste.
---------
THIS IS NOT FINANCIAL ADVICE

ANKRUSDT htting the falling wedge support | Upto 23% possibilityPriceline of ANKR / Thether US is moving within a falling wedge and hitting the support of wedge.
RSI is oversold.
MACD turned weak bearish from strong bearish.
Stochastic is oversold and likely to give bull cross soon.
Sell between: 0.00330 to 0.00372
Regards,
Atif Akbar (moon333)

ANKR breaking falling wedgeI don't know why it looks like that, but despite the whole market bleeding ANKR looks like bouncing (while breaking falling wedge). If not the BTC on the backside, I'd say it can get to 42-43, but tight now I am not sure. Certainly worth watching
ANKRBTC RSI Bullish divergencei think 36 sats is very good entry for this coin if you want to buy you can buy at 36-37 sat place your bid and let's goto moon together

ANKRUSDT is forming bullish CRAB | A good long opportunity aheadSofar the priceline of Ankr / TetherUS has completed all legs of CRAB pattern with required Fibonacci sequence so I am expecting the last leg will be completed accordingly.
As per Fibonacci sequence the targets are:
Buy between: 0.00410 to 0.00378
Sell between: 0.00435 to 0.00495
Regards,
Atif Akbar (moon333)


ANKRUSDT formed bullish BAT | A good long opportunityPriceline of Ankr / Tether US has formed a bullish BAT pattern and entered in potential reversal zone.
RSI is oversold.
I have defined targets using Fibonacci sequence as below:
Buy between: 0.00435 to 0.00428
Sell between: 0.00452 to 0.00478
Regards,
Atif Akbar (moon333)

ANKR (Ankr Network) Bottomed Out...!!ANKR (Ankr Network)
- Getting Ready to Bounce Back From Here.
- Facing Tiny Resistance At Here (46 Sats)
- Major Indicators Looks Bullish (MACD & RSI)
Buy Around 42 - 44 Sats
Sell Targets 56 - 65 Sats
Stop Loss Below 38 Sats
Please, give us your opinion in the comments!
If you like the idea, please, hit the Like button and subscribe to the profile in order not to miss our updates.
Join Telegram Channel for more analysis - t.me
The information given is never financial advice. Always do your own research

Ankr/Tether (Aug 14) #ANKR $ANKR #USDT $USDTWe can take risk to buy ANKR at 0.0045$ with tight stoploss if price is lower than 0.0044$ and buy back at 0.0037-0.00375$
