ANKRUSDT

ANKR possible tradeANKR has been forming this nice triangle and accumulating at a nice support level.
Right now we can see a nice breakout.
We need to see a test of our new support level... Then we can go in and wait for our profit.
Remember to set a stop loss!!
Red area - support level
Orange area - buying zone


ANKR CLEAN TECHNICAL ANALYSIS APRIL 14Looking at ANKR are on the 4hr chart price has made a large correction form a previous ATH
to a fib support area where a clean double bottom has been made,
price approached this area structurally with a descending channel with a 123 touch formation,
after the third touch price made an impulsive move to the upside and is currently making a
flag correction between the 718 and 618 fib range. overall anticipating price to make a
second touch to the bottom of this correction before making a continuation from the first impulse to the upside potentially hitting the 0.20 area

ANKR/USDT can still increase!Hi every one
ANKR / TETHERUS
chart is speaking it self!
ANKR/USDT is in a bullish flag which has not broken yet and there are also Hidden bullish Divergence (+HD) on RSI which will help the bullish trend to continue. If the break out happens there can be a bullish movement as big as the flag pole!
Traders, if you liked this idea or have your opinion on it, write in the comments, We will be glad.
Things can change...
The markets are always changing and even with all these signals, the market changes tend to be strong and fast!!
Thank you for seeing idea .
Have a nice day and Good luck

Ankr Ready?Ankr golden cross formation in 1 hour. The intersection of tenkan and kijun has occurred. There is no obstacle to the takeoff right now.
It is not investment advice.


💡ANKR: BUY Trade🚀🚀🚀🚀🚀🚀 #ALTSEASON2021📈#ANKRUSDT
➡️Entry: 0.1560$
🎯Target 1: 0.1850$
🎯Target 2: 0.2399$
🎯Target 3: 0.2820$

ANKR 1HR Breakout of triangle patternHi guys,
I will be short in explaining this long opportunity.
Ankr was in strong accumulation zone and now has risen above the resistance line and turned it support. Looking for a bullish continuation.
Entry at 0.15-0.16.
TP1: 0.22
TP2: 0.30
TP3: will do 1x at that point
Not financial advice.
DYOR!
Cheers!

ANKRUSDTHello to you all. Mars Signals team wishes you high profits at all times.
As you can see, the price has reached a good support level and the support provided, we intend to be able to touch the specified targets.
Warning: This is just a suggestion to you and we do not guarantee profits.
Wish you luck!

As my grandfather used to say. If you aren't in ANKR, u a wankr.(Disclaimer: he probably didn't say this, idk)
We are looking at making new all time highs. Target is in place for $0.275.

ANKR getting ready to bounce back!ANKR has lost momentum for the past few days and has now entered a symmetrical triangle pattern which most likely indicates that a major breakout is on the rise. Its market cap is still above 1B at the time of this post so revisiting the $0.21 price range in the next few days seems doable.

ANKR/BTC bull flag current update...Exit or hold position now?#ANKR/BTC Chart Update :-
#ANKR currently trading at 245 Satoshi
Now Trading below support level.
If you don’t feel good then exit but One more support at 236 Satoshi
So I can take some more risk.
If any 6 hours candle close below 235 Satoshi then I will exit from this trade.
Support:- 236 Satoshi
Resistance:- 307/350/418/481 Satoshi
Don’t wait for my updates if any 6hours candle close below 236 Satoshi. You can exit without any emotions.
Please click like button and Appreciate my hard work.
Must follow me for latest crypto real time updates .
Thank you.

Do you have any idea about the future trend of the $ANKR?Do you have any idea about the future trend of the $ANKR?
AMKR pattern ath 0.20$


ANKR easiest long of my life....This setup is still active!!
If ANKR broke POC at 0.166$ it will make easy +40%!!! Prices in chart. Always use stop loss...

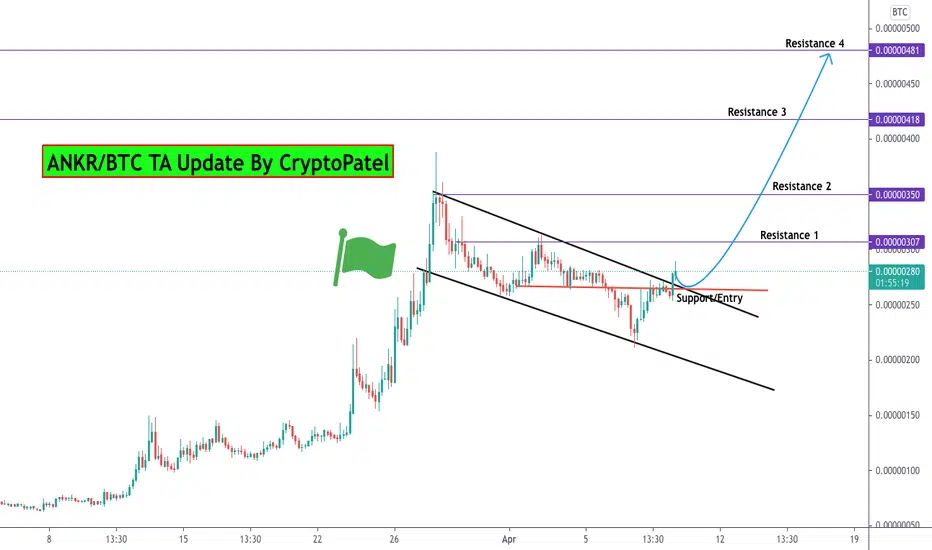
ANKR/BTC Bull flag TA Update#ANKR/BTC TA Update
( follower request )
#ANKR now bullish because now broke out bull flag resistance .
So we can buy some for short term gain.
Never invest too much in this tike because already 20x up from bottom.
Entry:- 260-280 Satoshi
Targets:- 307/350/418/481 Satoshi
Stop Loss:- if any Big time frame candle close below 250 Satoshi then strictly exit.
No emotion.
Support:- 250 Satoshi
Please click LIKE button and Appreciate my hard work.
Must follow me for latest crypto reap time updates.
Thank you.
ANKR USDT IdeaAlready Break out in lower timeframes
also, there is hidden bearish divergence in rsi and the price moving below Kumo clouds, so it should close some candles above the green line for more confirmation otherwise it can go lower
