ANKR/USDT – Weekly Macro Reversal from Historical Demand Zone!🧠 Analysis Overview:
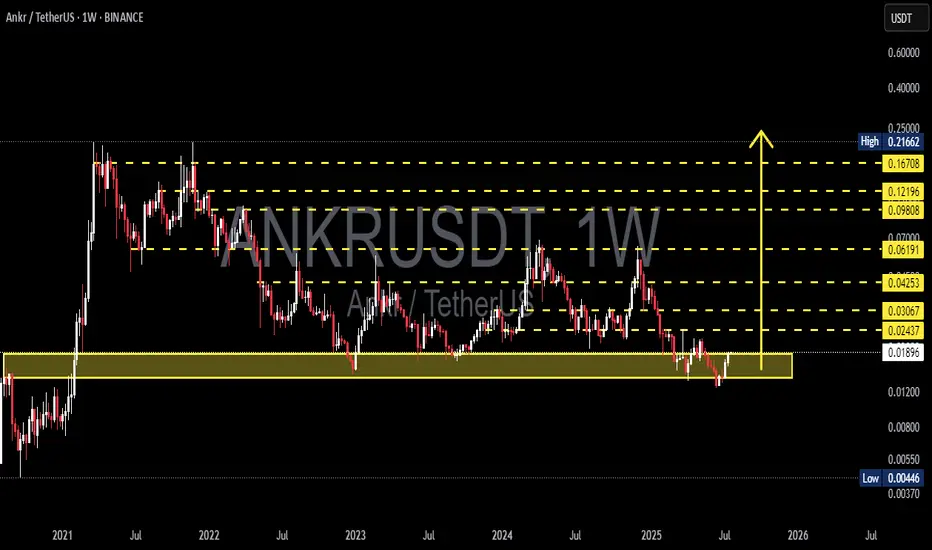
ANKR is showing strong signs of a potential macro reversal after bouncing off its historical demand zone around 0.017–0.019 USDT. This zone has proven to be a significant accumulation area in past cycles — fueling major rallies in both 2021 and 2023. The recent reaction at this level could mark the beginning of a substantial bullish leg in the mid-to-long term.
🔍 Pattern & Structure Breakdown:
✅ Demand Zone Re-Tested:
This zone has been tested multiple times over the years and continues to attract buying interest, signaling institutional accumulation.
✅ Potential Weekly Double Bottom:
Price has formed a clear double bottom with a strong bullish rejection candle, indicating buyers are stepping back in.
✅ Macro Accumulation Range:
For nearly two years, ANKR has been ranging between 0.018 – 0.21 USDT. It’s currently at the bottom of that range, providing a high risk-reward opportunity.
✅ Fibonacci Extension Targets:
Well-defined horizontal resistances (in yellow) suggest clear roadmap targets for bullish continuation — ranging from 0.024 to 0.216.
🚀 Bullish Scenario (HIGH PROBABILITY SETUP):
Ideal Entry Zone: 0.018–0.020 USDT
Initial Breakout Confirmation: Above 0.02437
Progressive Targets:
0.03067 – minor resistance
0.04253 – previous swing high
0.06191 – historical supply
0.09808 – 0.12196 – prior distribution zone
0.16708 – 0.21662 – cycle top targets
🎯 Potential Upside: 200% – 1000%+
📈 Trend Reversal Confirmed: Once weekly higher-highs are established
⚠️ Bearish Scenario (RISK MANAGEMENT):
Breakdown below 0.01800 could trigger:
0.01200 (intermediate support)
0.00700 – 0.00446 (macro-level supports)
❗️Bearish Bias Valid: On weekly close below 0.01700 with strong selling volume
🧭 Conclusion:
> ANKR is currently at a critical macro support zone with a technically sound reversal setup.
For swing traders and mid-term investors, this is a strategic area to monitor for potential trend shift.
Tight risk, massive reward.
📌 Strategy Recommendation:
Use DCA (dollar-cost averaging) in the demand zone
Place conservative stop-loss below 0.01700
Watch for breakout with volume above 0.02437 to confirm bullish reversal
#ANKR #ANKRUSDT #CryptoReversal #AltcoinSetup #WeeklyChart #SwingTrade #AccumulationZone #TechnicalAnalysis #LowCapAltcoin #FibonacciTargets
Ankrusdtanalysis
ANKRUSDT 1WANKR ~ 1W Analysis
#ANKR Buy back when testing this support with a short -term target of at least 15%+.

ANKRUSDT 1WANKR ~ 1W Analysis
#ANKR If you still have a Conviction on this coin. Maybe this support block you can consider to start buying back with a short -term target of at least 20%+.

Will ANKRUSDT Finally Break Out? Key Levels to Watch Now!Yello, Paradisers! Is ANKRUSDT gearing up for a breakout, or is more downside coming? Let’s break it down.
💎ANKRUSDT has been forming a well-defined descending channel with a triple zig-zag pattern and bullish divergence, increasing the probability of an upcoming bullish move.
💎For a confirmed breakout, ANKRUSDT must show strength, break above the descending channel and resistance, and close a candle with strong volume. If that happens, the probability of a bullish move significantly increases.
💎In case of a retracement, a short-term bounce could be possible if we get a bullish Internal Change of Character (I CHoCH). However, considering the broader crypto market conditions, this remains a low-probability setup.
💎On the other hand, if we see panic selling, leading to a breakdown and candle close below the key support level, it will invalidate the bullish setup entirely. In that case, it’s best to wait for a stronger price action formation before taking any trades.
🎖 Patience and discipline are key in such setups, Paradisers. The market will always offer new opportunities—our job is to wait for the highest probability trades and execute with confidence. Stay sharp!
MyCryptoParadise
iFeel the success🌴
