#APE/USDT Low Risk vs High Rewards#APE
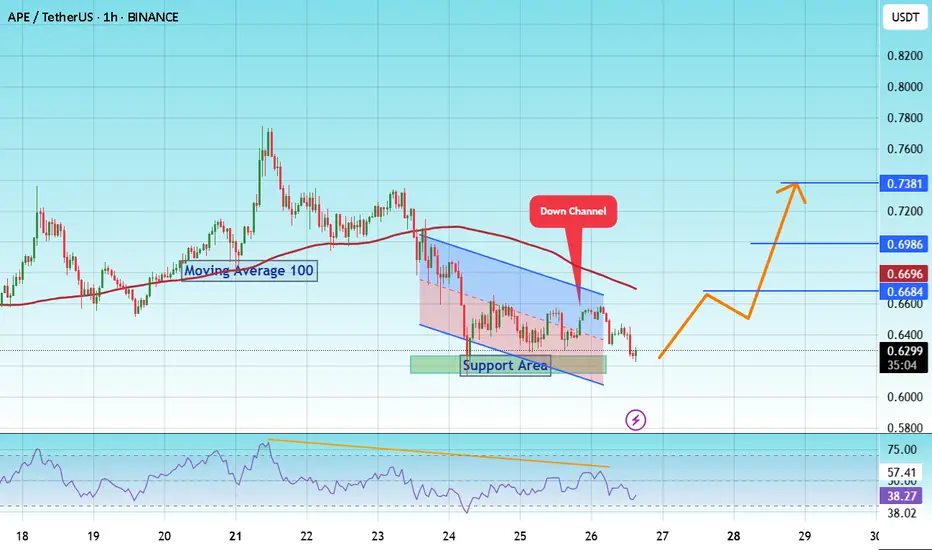
The price is moving within a descending channel on the 1-hour frame and is expected to break and continue upward.
We have a trend to stabilize above the 100 moving average once again.
We have a downtrend on the RSI indicator that supports the upward break.
We have a support area at the lower limit of the channel at 0.6080, acting as strong support from which the price can rebound.
We have a major support area in green that pushed the price upward at 0.6180.
Entry price: 0.6300
First target: 0.6633
Second target: 0.6986
Third target: 0.7380
To manage risk, don't forget stop loss and capital management.
When you reach the first target, save some profits and then change your stop order to an entry order.
For inquiries, please comment.
Thank you.
APE
Apecoin Technical Analysis · New All-Time High & Easy TargetsAs I told you just recently, the moving averages can be used in different ways. The main way is to gauge the market bearish or bullish potential and this is the classic way. The second one, less conventional, is to know how advanced is a trading pair within the current cycle.
Before everything was growing, we would confirm a pairs bullishness by looking at EMA55, EMA89, EMA144, MA200, etc. But now that we have a confirmed bullish bias, we can use these same moving averages to see how much room there is left for growth. For example, here APEUSDT is trading below EMA55 weekly. This is great news. This reveals to us that this pair is still early. As we know the entire market will move upwards based on the classic four years cycle—a bull market every four years, or the fact that a bull market happens the year after Bitcoin's halving—catching a pair before a major breakout can be life changing, profits can be huge.
But we still need some bullish signals though so let's look at those. Apecoin moved below its August 2024 market bottom. This is bearish. Once the action is happening back above this long-term support level the bullish bias is confirmed. Currently, APEUSDT is trading above its August 2024 low.
Another good and strong bullish signal is the classic rounded bottom pattern. On the 7-April low a rounded bottom pattern formed to produce a reversal. Notice how the trading volume is much lower on the last low compared to previous action. If the market was set to continue lower long-term, the lowest point would have high volume. Lower lows with decreasing volume signals that the bearish trend is losing force. This is already confirmed here because Apecoin produced a higher low in June and has been closing green several weeks.
Technical analysis coupled with marketwide action. Apecoin is set to grow strong long-term.
Thank you for reading. I hope you find this information to your liking. I hope you make tons of profits in this bull market cycle and fulfill all of your goals. You are appreciated.
Namaste.

ApeCoin Quick Update —Moving Next#APE
The price is moving within a descending channel on the 1-hour frame, adhering well to it, and is heading for a strong breakout and retest.
We have a bounce from the lower boundary of the descending channel, this support at 0.5827.
We have a bearish trend on the RSI indicator that is about to be broken and retested, supporting the upside.
There is a major support area in green at 0.5600, which represents a strong basis for the upside.
Don't forget a simple thing: ease and capital.
When you reach the first target, save some money and then change your stop-loss order to an entry order.
For inquiries, please leave a comment.
We have a trend to hold above the 100 Moving Average.
Entry price: 0.6000.
First target: 0.6194.
Second target: 0.6378.
Third target: 0.6612.
Don't forget a simple thing: ease and capital.
When you reach the first target, save some money and then change your stop-loss order to an entry order.
For inquiries, please leave a comment.
Thank you.

APE coin cup & Handle. This chart shows good potential as the #Alts start to take back center stage form #BTC
neckline around 79c
could be a triple if Alts can sustain an uptrend.
it's been a while
but the time is now
if it is to be the case.

APEUSDT Poised for a Breakout! Cup & Handle Pattern Forming"Classic Pattern in a Bearish Market – A Big Move is Brewing!"
🧠 Technical Analysis Summary:
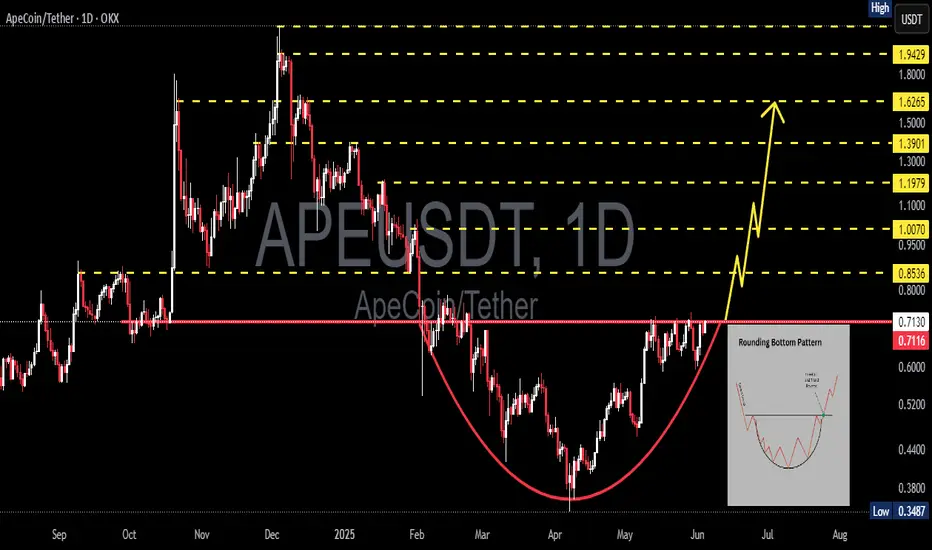
On the APE/USDT daily chart, we can clearly identify a Cup and Handle pattern, a classic bullish reversal structure that often signals the beginning of a significant rally. While many traders may be discouraged by the recent sideways movement, this formation indicates that smart money accumulation is happening quietly behind the scenes.
📌 Pattern Structure Breakdown:
🔴 The Cup:
Formed after a steep drop in late 2024, followed by a smooth rounded bottom that developed through May 2025.
The "U-shape" indicates a healthy recovery and accumulation phase, often seen before major trend reversals.
🟡 The Handle:
Currently forming a descending channel or bullish flag, representing a consolidation phase or "shakeout" before the next upward impulse.
This is typically the final dip before breakout in classic Cup & Handle formations.
📈 Key Resistance:
The yellow downward trendline is the neckline of the pattern.
A breakout above the $0.63–$0.65 zone will confirm the pattern and potentially spark a major move upward.
✅ Bullish Scenario (Upside Potential):
If a breakout is confirmed with strong volume and a daily candle closes above $0.65:
First target: $0.7452 (initial resistance)
Mid- to long-term bullish targets (measured from cup height):
🔹 $0.8658
🔹 $0.9934
🔹 $1.1931
🔹 $1.3804
🔹 $1.6171
🔹 $1.9585
🔹 $2.1669 → Main Cup & Handle Target
⏫ These targets are realistic if market sentiment turns bullish again and momentum builds.
⚠️ Bearish Scenario (Downside Risk):
If the breakout fails and price breaks down below the handle’s support zone:
Immediate support: $0.57 – $0.52
If $0.52 fails to hold:
🔻 $0.43
🔻 $0.3487 (Previous major low)
The pattern becomes invalid if the price breaks below the cup’s base at ~$0.43, suggesting bearish continuation.
📊 Additional Notes:
Volume is key. A valid breakout must be accompanied by a noticeable surge in trading volume.
Look for confirmation via RSI breakout or bullish divergence, and watch how price interacts with major moving averages.
Beware of false breakouts – a daily candle close above resistance with volume is the ideal confirmation.
💡 Final Thoughts:
APEUSDT is at a critical juncture. The nearly completed Cup and Handle pattern could be the launchpad for a major bullish rally. However, caution is advised—risk management and confirmation are essential for success in volatile crypto markets.
#APEUSDT #ApeCoin #CryptoBreakout #CupAndHandle #AltcoinAnalysis #TechnicalAnalysis #PriceAction #BullishCrypto #CryptoSetup #TradingSignal

ApeCoin (APE) Cup Pattern (1D)After a deviation below demand, BINANCE:APEUSDT formed a clean rounded bottom, reclaimed the zone, briefly consolidated, and it's now attempting to break above resistance.
Key Levels
• $0.79: Current resistance
• ~$0.65: Current support, breaking it might lead to the formation of a handle
• $0.50-$0.60: Main demand zone and logical pullback target in case of a handle
• $1.20: Measured breakout target, and previous swing high
Worth watching it closely for a daily close above $0.79 with good volume to activate the target.
Alternatively, look at the $0.50-$0.60 area for a reversal in case of a rejection here.

TradeCityPro | APE: Key Breakout Watch in Gaming Token’s Range👋 Welcome to TradeCity Pro!
In this analysis, we’re taking a look at the APE coin — one of the prominent American gaming and metaverse projects that gained major traction during the last bull run.
⭐ Currently, APE holds a market cap of $540 million and ranks 110th on CoinMarketCap.
📅 Daily Timeframe
As shown on the daily chart, price has reached a key resistance zone and has tested it several times.
✔️ If this resistance breaks, it could confirm a trend reversal, potentially opening the way toward higher levels like 0.8990 and even 1.973.
🛒 For spot buying, an entry can be considered upon the breakout of this resistance, though it's safer to wait for confirmation of bearish momentum in Bitcoin dominance before entering a spot position on APE.
📈 However, for futures positions, this same breakout trigger can be used — either on the daily chart or lower timeframes.
🔽 On the short side, a support level has formed at 0.6073. A break below this could extend the bearish trend toward 0.3833.
⚡️ Still, there’s a major support level nearby at 0.5633. If you’re looking for a more conservative short entry, you might wait for a clean break below 0.5633.
💥 Momentum confirmation for the short position would come with an RSI breakdown below 46.46, which would signal stronger bearish pressure entering the market.
📝 Final Thoughts
This analysis reflects our opinions and is not financial advice.
Share your thoughts in the comments, and don’t forget to share this analysis with your friends! ❤️

APEUSDT 1D AnalysisAPE ~ 1D Analysis
#APE This trade is very risky
Buy after successfully breaking this resistance line with strong volume. With a short-term target of at least 15%+.
ApeCoin Quick Update —Moving NextWe looked at ApeCoin recently and I was certain this pair was set to move forward... What happened? Nothing really. Look at the action the last five days. The three red days were a nothing, just a small retrace and sideways consolidation. Now we are full green again.
I mentioned how the top performers will change now in this newly developing bullish continuation, there is more. The first wave peaked after 100 and 300% profits, the second wave will be between 200 and 500% profits for each pair on average. Awesome isn't it?
» Then there will be even more so this is only the start.
This is a timing based publication. APEUSDT is set (likely) to move next.
Note. Remember, it can always take longer than expected but the bigger picture doesn't change. It is going up. Buy and hold. The market takes care of the rest.
Namaste.

APE is showing early signs of accumulation after prolonged conso"APE is showing early signs of accumulation after prolonged consolidation. With improving sentiment in the altcoin market and potential catalysts on the horizon, this could be one to watch. Patience and proper risk management remain key. 🦍📈 #APE #Altcoins #CryptoTrading"

ApeCoin 369% Target Explained —Altcoins 2025 Bull MarketThis is an interesting pair. The entire Altcoins market is waking up now and gaining in bullish momentum. I just want to show you the target.
From the April bottom to present day, Apecoin has grown by ~100%, which is nice, solid, but there is great potential for additional growth.
The second target at 369% from current price, at the time of writing, would yield more than 840% from the April bottom. So if this isn't the 2025 all-time high, which I believe won't be, then the total growth potential for this bullish cycle is astonishing. It will be huge.
So far we continue to see and experience slow and steady growth, but soon, the Altcoins market will produce amazing growth. It will be something to experience, it is good now to buy and to hold LONG.
Namaste.

ApeCoin Uptrend Points To 438% Mid-Term TargetThe black lines are the bottom lines. The action below the lower black line is the actual bottom. ApeCoin (APEUSDT) trading above the higher black line is 100% bullish zone bullish confirmed. You see on the chart the development of an uptrend, it is already underway.
Orange = downtrend. 5 months. December through April.
Right side = uptrend. ~8 months. April through late 2025.
The duration of the uptrend can vary of course, can be much longer or shorter. What we can know for sure is that market conditions have changed. We are 100% bullish now. Cryptocurrency is bullish now. The Altcoins are bullish now. ApeCoin has been growing for more than a month.
» Easy target on the chart 438% with more long-term. This one can hit within 1-3 months (mid-term).
Thank you for reading.
Namaste.

#APE/USDT#APE
The price is moving within a descending channel on the 1-hour frame, adhering well to it, and is heading for a strong breakout and retest.
We are seeing a bounce from the lower boundary of the descending channel, which is support at 0.5060.
We have a downtrend on the RSI indicator that is about to be broken and retested, supporting the upward trend.
We are looking for stability above the 100 moving average.
Entry price: 0.5386
First target: 0.5528
Second target: 0.5720
Third target: 0.5887

APE Main trend. Channel. Wedge. Reversal zones 05 05 2025Logarithm. Time frame 1 week.
1️⃣ Decline from the maximum by -98% , which is acceptable for assets of such liquidity and capitalization, after that either a trend reversal (main), or a complete scam.
2️⃣X (twitter) of this crypto project has 473 thousand subscribers . This army will be sent to pump this cryptocurrency at the right time in the so-called 3rd alt season of this cycle.
🟣And now work with a breakout of the descending wedge, and the price movement to the resistance of the descending channel. The percentage locally - medium-term showed for clarity from two zones - scenarios.
3️⃣The third plus is that this cryptocurrency is traded on 4 liquid exchanges: binance, bybit, okx, and most importantly Coinbase.
Line chart (trend direction and liquidity).

APE: Ending a Complex Bearish Trend#APE has been in a bearish trend since launching in April 2022. Now near an ATL, it recently bounced off a key Fib extension level.
With a stop-loss below $0.40 and a major trend shift above $2.20, a strong reversal is currently needed for future bullish targets.
#Apecoin

#APE/USDT#APE
The price is moving within a descending channel on the 1-hour frame, adhering well to it, and is heading for a strong breakout and retest.
We are seeing a bounce from the lower boundary of the descending channel, which is support at 0.4548.
We have a downtrend on the RSI indicator that is about to be broken and retested, supporting the upward trend.
We are looking for stability above the 100 moving average.
Entry price: 0.4875
First target: 0.4718
Second target: 0.4794
Third target: 0.4875

APEUSDT 1D AnalysisAPE ~ 1D Analysis
#APE successfully broke through this resistance line, expecting a 10%+ increase from here.

#APE/USDT#APE
The price is moving within a descending channel on the 1-hour frame, adhering well to it, and is heading for a strong breakout and retest.
We are seeing a bounce from the lower boundary of the descending channel, which is support at 0.4040.
We have a downtrend on the RSI indicator that is about to be broken and retested, supporting the upward trend.
We are looking for stability above the 100 moving average.
Entry price: 0.4122
First target: 0.4223
Second target: 0.4330
Third target: 0.4464

APE Analysis | Lost in the Jungle or Making a Comeback? (1D)The larger-degree APE pattern appears to be a large symmetrical triangle, and we are currently in the G wave of this pattern. The G wave is bearish, and within the G wave, we can also observe a smaller-degree symmetrical triangle.
It seems we are nearing the final leg of this pattern, and we expect one more drop from the red box. If the price reaches the green zone, we may have a low-risk opportunity to enter a buy position.
Potential targets are marked on the chart.
A daily candle closing below the invalidation level would invalidate this outlook.
For risk management, please don't forget stop loss and capital management
When we reach the first target, save some profit and then change the stop to entry
Comment if you have any questions
Thank You

ApeCoin 666% —The Uptrend From Hell (How To Maximize Profits)It has been now five months and a half since this downtrend here on the ApeCoin chart got started. The candles fit perfectly within a descending channel.
The highest bearish volume session happened 24-February. This is followed by the highest volume day ever, then APEUSDT continues lower and producing lower lows with minimum trading volume.
The 7-April low ended closing green and with a reversal candle. It is easy to see that the downtrend has no strength. It is no surprise then to find out that I am calling for a reversal now, a change of trend.
» How does one can maximize profits from a chart set up like this one?
Buy as low as possible and sell as close as possible to the top. Right now we don't know where the top is but we can easily spot the bottom. The bottom the current price and trading zone. At whatever price ApeCoin is trading now will remain the bottom when action turns green. There can be shakeouts and swings and this wouldn't change anything for you and me. A spot trader should only buy and hold. If the market lowers, nobody cares, we wait. If the market moves higher; truly awesome, this is great.
» How to maximize profits?
Buy now and wait.
Namaste.

One-trick Pony Club pumped and dumped`If you wonder how much all the monkey pictures are REALLY worth, you should check YouTube video:
"Right Clicking All The NFTs"
by Coffeezilla
with 1,399,517 views
uploaded on 21 Dec 2021
The story of sh1tcoins (Bored Ape Yacht Club and all the rest):
Once upon a time, a rich man from the city arrived in a village. He announced to the villagers that he would buy Monkeys for 100 each.
The villagers were very happy, after all there were hundreds of Monkeys in a nearby forest. They caught the Monkeys and got them to the rich man. He bought hundreds of Monkeys and paid 100 for every Monkey the villagers gave him. They began to make a living out of getting Monkeys from the forest and selling it to the rich man.
Soon, the forest began to run out of monkeys that were easy to catch.
Sensing this, the rich man offers 200 for every monkey. The villagers were ecstatic. They went back to the forest, set up traps and caught the monkeys and got them to the rich man.
A few days later, the rich man announced he would pay 300 per monkey. The villagers began climbing trees and risking their lives to catch monkeys and get them to the rich man – who bought them all.
There were no Monkeys left in the forest!
One day, the rich man announced he would like to buy more monkeys – this time for 800 each.
The villagers couldn’t believe this. They were desperately trying to get more monkeys..
Meanwhile, the rich man said he had to go back to the city on some business work and until he returns his manager would deal on his behalf.
Once he left, the villagers were unhappy. They were making quick and easy money from selling monkeys, but the forest no longer had monkeys.
This is when the manager of the rich man stepped in. He made an offer the villagers could not refuse. Pointing out to all the monkeys that the rich man had caged. He told the villagers he would sell the monkeys for 400 each.
“Sell them back to the rich man at 800 each when he comes back” the manager said.
The villagers were over the moon. Buy for 400 and sell for 800 in few days. They had just found the easiest way to double their money. The villagers collected all their savings and even borrowed money. There were long queues and within a few hours, almost all the monkeys were sold out.
Unfortunately, their happiness did not last long, as the manager went missing the next day and the rich man never came back.
Many villagers kept the monkeys with them, hoping the rich man would come back. But soon, they lost hope and had to let the monkeys back into the forest as feeding and taking care of the noisy monkeys became extremely difficult.

Breaking: Apecoin ($APE) Surges 10% Today, Enroute To $1Apecoin's native token ( GETTEX:APE ) which is an ERC-20 governance and utility token used within the APE Ecosystem to empower and incentivize a decentralized community building at the forefront of web3 surge 10% today defying market odds and setting coast for the $1 pivot.
Apecoin has had its own fair share of the market dip lately for an asset with an All -time high of $39.40 during the NFT hype but tanked so hard currently trading at 0.421 per GETTEX:APE coin.
Chart patterns indicate the potential of a breakout in either direction once the asset breaks above the symmetrical triangle pattern formed. Similarly, a break below the symmetrical triangle could resort to a bearish trend for GETTEX:APE coin.
The NFT market is still new albeit further developments is needed to bring the NFT hype back to life, with Apecoin ( GETTEX:APE ) standing at the forefront of NFT's galore.
ApeCoin Price Live Data
The live ApeCoin price today is $0.419761 USD with a 24-hour trading volume of $54,383,857 USD. ApeCoin is up 8.72% in the last 24 hours, with a live market cap of $315,933,934 USD. It has a circulating supply of 752,651,515 APE coins and a max. supply of 1,000,000,000 APE coins.

APEUSDT: Will This Major Resistance Trigger a Sharp Rejection?Yello Paradisers, have you spotted what’s brewing on APEUSDT? We’re sitting at a critical zone—one that could either trigger a steep drop or trap late shorts before a breakout. Here's why this level demands your full attention.
💎APEUSDT is showing strong bearish potential, currently trading inside a rising wedge pattern accompanied by bearish divergence. What's even more crucial is that this price action is unfolding right at a key resistance zone, reinforced by both the 0.618 Fibonacci level and the 200 EMA. This confluence of technical factors significantly increases the probability of a bearish rejection from here.
💎If APEUSDT consolidates around this level and begins forming clear bearish structures—such as an M-pattern, a bearish CHoCH (Change of Character), a Head & Shoulders, or even an Inverse Cup & Handle—the bearish case strengthens further. This would also allow for a tighter risk setup, improving the risk-to-reward ratio for traders who are patient and precise.
💎On the flip side, if the price breaks and closes decisively above the invalidation level, this will invalidate the bearish setup entirely. In that scenario, the smart move would be to wait for a new structure or a clean retest before making any trading decisions.
🎖This is the only way you will make it far in your crypto trading journey. Be a professional—stick to your plan, reduce your risk, and never chase the market. Timing and discipline are what separate consistent traders from the rest. Stay sharp, Paradisers.
MyCryptoParadise
iFeel the success🌴
