APE CAN DROP AGAINI hope you are fine
We have a swap level, if the candles pull back to this area, it is suitable to open short positions.
Don't forget volume management, leverage and stop setting
Comment if you have any questions
APE

APE Squeese $we broke our resistant around the 1.50$ premarket now is our support , and we have to break another resistant on the market opens at 1.77$, cause if we got rejected we going to test near above support area 1.50$ and then break that resistant to go the profit taking around the 2$+ and 2.30$.
if we broke the support 1.50$, is means we going to fail the gap above the 1.30$.

APEVery simple ... Very clear!
Everything is marked on the chart.
This is my personal opinion. Please do not trade based on my analysis and data.

BBIG Vimco Ventures - A Classic Triangle PumpI came across this stock the other night when it was trending on Twitter and took a look at it for the first time ever. Apparently Vimco is a holding company that's touted for one of its assets being the "TikTok competitor" Lomotif.
Personally, I think people who are bullish on app clones of big apps are delirious because the reason those big apps get rooted by the establishment are for reasons that have little to do with their technology and everything to do with what is behind them.
In TikTok's case it's the Chinese Communist Party behind them, via parent company ByteDance, and the purpose of the app is to indoctrinate young people and have them waste a lot of time competing with influencers and trying to be an influencer .
The thing about a grooming and indoctrination app is you can't have competition. You need just one that can cannibalize the entire market and hold everyone's attention.
Regardless, I'm a big believer in price action. So long as Wall Street banks are holding an interest in a stock, I think that price action reflects the cumulative knowledge of all market participants. It's the real penny stock pump and dumps you have to be afraid of. Once they get rugged there's no liquidity and they _will_ go to zero.
With BBIG, BlackRock, Vanguard, State Street, etc, all have significant holdings.
Before we start, I'd just like to say that I actually saw this pattern the night before and posted it as it began its fake breakout, just not in a formal TradingView call.
Anyways, this pattern is a pretty classic one that I learned from this dude in crypto in 2018 when Ethereum Classic made a similar play that yielded a lot of run, and fast. I didn't believe him, but the short end of the trade worked and then it pumped afterwards.
The idea is you first get this parabolic super pump that doesn't last. Then, it consolidates for a long period of time with descending highs and flat lows.
What's being exploited is that so many traders love these trendline astrology "technical analysis" ideas. So when they see something "break out" to the upside "against the trendline" they stop out of their shorts and get long.
Then it immediately sells off back into the triangle, and then takes out the bottom, and heads lower and lower, taking out all those poorly timed longs that bought in the triangle, treating the flat bottom as support.
Notable with BBIG is that there's a pre-pump gap in the 71c range and the all time low, which is also the pre-pump pivot low, is 67c.
I suspect that 67c will hold under the thesis that the MMs are actually heavy on the buy, but if the pump is going to be big, they may also turtle soup the very bottom.
Either way, you might think to yourself, "This isn't that realistic. This is 20%+ to the downside." And this logic is fine, but look at the range of the triangle breakout into the breakdown that just occurred. In a few days that was already 20%.
Late in October, BBBY printed a 35% pump in a few days.
A conservative target for the resulting pump, should it manifest as such, is in the $1.40 range. It may even take out the old pump high of $1.95. In short, you're looking at a 2-3 bagger, if all transpires according to plan.
Price action like this leads me to believe that it's possible that the Biden Administration really does have a ban on TikTok waiting in the cards, ready to be imminently played as social media chatter has suggested.
Additionally, I also believe that tech stocks in general are about to pump it and pump it hard, even though it'll just be another bear market rally. A lot of suckers are about to be brought in.
Well, with a stock like this you don't want to buy and hold. You want to get in and get out. A lot of these companies really have no fundamental value. If you want things to buy and hold, put your money in grocery stores, fertilizer companies, oil and gas, etc.
Things that genuinely make money from genuine business, instead of these jokers that pay some kids pennies to clone apps and then call it a $205MM valuation, which is what Vimco's market cap is at the moment. (That's tiny.)
But, be careful and don't be greedy with your upside targets. The world isn't in good shape at the moment and things can change at any time.
Significant geopolitical, natural, and cosmic events can unfold at any time.

Billions of shares sold short, market manipulation, and CitadelOver the past few months, the AMC/APE craze has been underway, with plenty of retail investors spamming various social networks and prompting others to buy the company’s shares. As per the information in tweets, memes, and messages, this retail investors’ uprising aimed to bring down hedge funds, with the central target being Citadel.
There were numerous instances during this time when people claimed the price of shares would burst into multiples if all investors stuck together and continued buying collectively, not allowing hedge funds to buy shares and close their short position (leading to their downfall). In fact, during this period, we encountered numerous statements about billions of shares being sold short. Meanwhile, only about 513 million shares were outstanding for AMC and 519 million for APE in the third quarter of 2022. At the same time, the short interest on AMC shares amounted to approximately 20%, with 101 million shares being sold short; and only 33.5 million shares of APE being sold short.
These figures obviously deviate too far from what the retail narrative promotes. Furthermore, many people promoting this narrative and encouraging others to buy shares do not seem to realize what they are doing might be potentially criminal and classified as market manipulation. Furthermore, a lot of information concerning the whole craze is entirely wrong. Many people seem confused about “wrapped-AMC token” with over 8 000 000 000 000 000 in supply being related to the AMC company. However, anyone can create a token and name it “AMC token,” regardless of whether it is associated with the company. As for Citadel, we have failed to find any disclosure of their short position on AMC/APE during the respected period.
In our series of tweets last month, we warned that the regulator has most likely learned a lesson from 2021 and would step in and halt trading if buying activity picked up significantly. Shortly after that, that is what occurred when the regulator poured cold water on the rally with a temporary halt to trading. Year to date, shares of AMC are down approximately 70%, which is far away from what was promised by those shouting “buy and hold.” Therefore, this whole situation should serve as a reminder of being cautious about what you see and listen to. Always do your due diligence.
Illustration 1.01
In the 2021 meme stock hysteria, shares of AMC jumped up as high as 44.61$.
Please feel free to express your ideas and thoughts in the comment section. Additionally, if you have more information on this topic, feel welcome to share it with us.
DISCLAIMER: This analysis is not intended to encourage any buying or selling of any particular securities. Furthermore, it should not be a basis for taking any trade action by an individual investor. Therefore, your own due diligence is highly advised before entering a trade.

ApeCoin shortApeCoin broke trough the ascending trendline. Asset broke trough the support level. Bearish movement to support level at 2.87 is possible.

🔥🚀APE WILL SKYROCKET AFTER THIS FALSE BREAKOUT🔥 Hi friends! APE is a very volatile altcoin that gives the best possibility for traders to make money even in a short-term period.
I expect the local pump on crypto after some pullback. The best time to open a long trade on APE is a false breakout of the $3.25 key level.
📊 PRECONDITIONS TO OPEN A LONG ON APE:
🔥 false breakout of the key level of $3.25
🔥 volume growth
🔥 bullish BTC
✅ THE LONG TARGETS FOR APE:
1. $3.9-4.1 - value area
2. $4.6 - a key level
3. $5.2 - key level and local high
🚩 Traders, the market is very weak now, and if you will see the bearish BTC sentiment, I recommend you to book most of your profit and put sl in a breakeven.
Also, I recommend you to open a short if you will see the sign of trend reverse. Altcoins fall really good at that stage of the market cycle and our shorts will be very profitable.
💻Friends, press the "boost"🚀 button, write comments and share with your friends - it will be the best THANK YOU.
P.S. Personally, I open an entry if the price shows it according to my strategy.
Always do your analysis before making a trade.

APE. Doesn't make sense until the Metaverse launches.In the spring of 2023, giant amount of tokens unlock reserved for Yuga Labs and BAYC founders begin. Add to this the start of staking, where the happy bored ape NFT owners and whales will earn income. Descending triangle target is exactly worked out. From now on, I only foresee a downward movement, since there is no token utility for other than selling.

ApeCoin APE prediction for the end of the year previews forecast
APE/USDT short
Entry Range: $4.20 - 4.50
Price Target 1: $3.70
Price Target 2: $3.30
Price Target 3: $2.75
Stop Loss: $5.25

MY PERSPECTIVE FOR CHZ MIDTERMBTC STILL GOOD you can check btc chart and see and soon there opportunity on DOGE will posted today
These trades reflect my trading history and are not investment advice and I am not your financial advisor
Trades will be updated on the same published chart such as Take Profit, Early Exit or Partial Exit..... Good luck to all

Ape coin staking has started but the near future looks bleakApe coin staking started with great success for Yuga Labs and BAYC members. However, the macro economic conditions put additional stress on the Ape coin especially if it leads the members to cash out their stake rewards consistently. It will create consistent downward price pressure on APE. Technicals indicate price action to revisit under $3 again.

APE long @ 3.650 10x leverageAPE has hit a major area of support as the TOTAL and BTC bottom out in momentum once again.
This coin is far beneath the Keltner Channel and I believe with the past confluence of price action in this area we'll find support to retest back into the channel.
We're far underneath our 200-day EMA and I believe we will retest it as resistance.
We are seeing a massive floor forming in the TOTAL and APE 1-hour charts.
We have no bearish Ichimoku cloud resistance in the local area.
I may add onto this position as time goes on.

APE BUY SETUPHello, dear traders. how are you ? Today we have a setup to buy/long the APE symbol.
For risk management, please don't forget stop loss and capital management
When we reach the first target, save some profit and then change the stop to entry
Comment if you have any questions
Thank You

Ape fell out of the treeHard in the paint painting this chart red with 100X margin puts. This ape ran out of bananas. Yehawwww!!

APE about to make a strong breakout APE / USDT
From recent price action we can see a 7 months of resistance about to breakout
If breakout done successfully ✔️ , strong bullish wave is expected

APE - steaking put into the projectLast week they introduced stacking. According to observations after stacking, the coin starts to downmoves.
Technically we are above the bear trend.
and below the resistance level of $4.5.
The trendline blues are acting as support and if the price goes near them, the price will most likely fly to $3.5
In any case, there are a lot of layouts.
I will only make a breakdown of this level or trend line.
If you liked the idea, please like it. That's the best "Thank you!" for the author 😊
P.S. Always do your own analysis before a trade. Put a stop loss. Fix profits in installments. Withdraw profits in fiat and make yourself and your
your friends.

APE Bullish !Hello guys so now it is very bullish not only because chart but fundamental its very positive something like AXS coin😊 We need to confirm first green rezistance , after confirm i think we will see big pumps !
Hit me like if you agree and check other analysis !

crypto/usdt if you wanna 90 win stratgy use you dont need to now any thing for this stratgy how its woork evey entry you take you put a stop lose right do not trade just put a lmit sell/buy at your stop lose it will work at any market 5min 15 min h4 D DONT FALL FOR CONFEMATION YOU WILL GONNA GET F

APEUSDT Looks Bullish!APEUSDT Technical analysis update
Curently trading at $4.24
Buy zone: $4.21- $4.26
Stop loss : $3.99
Take profit 1 : $4.46
Take profit 2 : $4.73
Take profit 3 : $5.00
Always keep stop

APE CAN GO UPPERHello, dear traders. how are you ? Today we have a setup to buy/long the APE symbol.
For risk management, please don't forget stop loss and capital management
When we reach the first target, save some profit and then change the stop to entry
Comment if you have any questions
Thank You

APE BULLISH MOVE INCOMING🦧 #APE/USDT produced a cup & handle on 4h timeframe🧐
Send it to 5$ if we break out and confirm the pattern📈

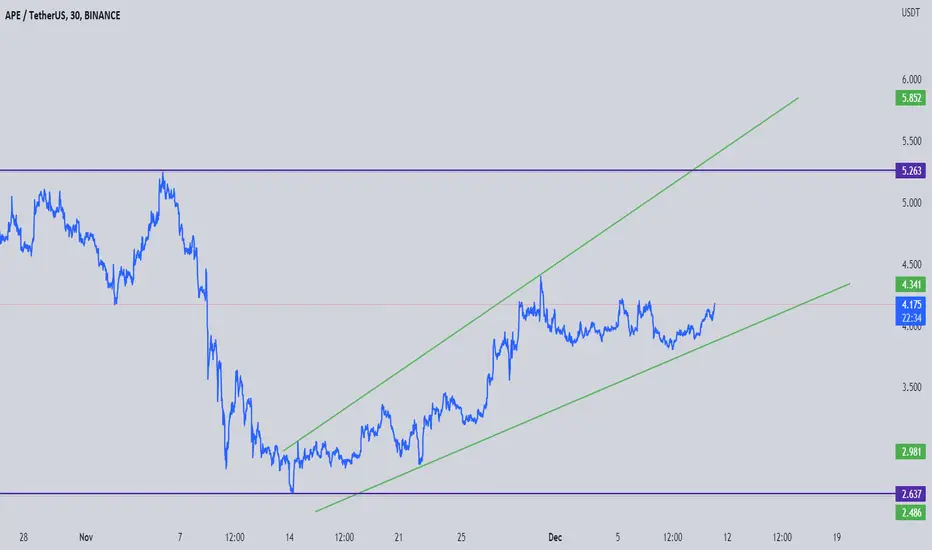
APE longOn the 1D timeframe a downward wedge was formed on the coin. Since the beginning of December the price has been walking near the upper boundary of this wedge...
I think very soon we will break up!

APE: TA VIEWDepending on TA APE showing interesting views for long trend
Interesting to see if this coin can get some confirmations coming time.