APE Has broken above 1.850APE Has broken above 1.850, the pullback might be very short due to the strong Bullish engulfing candle.
🔵Entry Zone 1.769 - 1.835
🔴SL 1.6361
🟢TP1 1.9198
🟢TP2 2.1440
🟢TP3 2.3661
Risk Warning
Trading Forex, CFDs, Crypto, Futures, and Stocks involve a risk of loss. Please consider carefully if such trading is appropriate for you. Past performance is not indicative of future results.
If you liked our ideas, please support us with your likes 👍 and comments.
APE

Apeusdt... Tecnicall analysis In addition to being broken, ape has finished its downward trend in the weekly time, and I think it is prone to upward growth...
please trade with your own analysis, I am not responsible for your losses.🧏🏽♀️

$APE gotta be mooned, am i wrong?#Ape broke out the descending wedge while weeks ago , retested successfully and now it' s time to: Moon.
NOT FINANCIAL ADVICE.

APE Picture Perfect Accumulation 2It just doesn't get any better than this. We came up off that STB into the AR high, put in a lower high, re-accumulated into the LPS and took off upwards. We'll consolidate up here around the SOS high for a bit before we continue upwards from here

APE: Descending Triangle BreakoutTrade setup : Bullish breakout form a Descending Triangle pattern, above 200-day moving average and $1.50 resistance could signal resumption of uptrend, with +20% upside potential to $1.80 thereafter. Stop Loss (SL) at $1.40, just below 200-day MA support.
Pattern : Price is trading in a Descending Triangle pattern. Typically, a breakout will occur in the direction of the existing trend. Most traders will take a position once the price action breaks through the bottom line of the triangle with increased volume, which is when the price should decline an amount equivalent to the widest section of the triangle.
Trend : Uptrend on Short-Term basis and Downtrend on Medium- and Long-Term basis.
Momentum is Bullish (MACD Line is above MACD Signal Line and RSI is above 55).
Support and Resistance : Nearest Support Zone is $1.25, then $1.00. The nearest Resistance Zone is $1.50, which it broke, then $1.80.

APE: Descending TriangleTrade setup : Price is in a downtrend, trading in a Descending Triangle pattern. Price needs to break above 200-day moving average and $1.50 resistance in order to signal resumption of uptrend, with upside potential to $1.80 thereafter.
Pattern : Price is trading in a Descending Triangle pattern. Typically, a breakout will occur in the direction of the existing trend. Most traders will take a position once the price action breaks through the bottom line of the triangle with increased volume, which is when the price should decline an amount equivalent to the widest section of the triangle.
Trend : Neutral on Short-Term basis and Downtrend on Medium- and Long-Term basis.
Momentum is Mixed as MACD Line is above MACD Signal Line (Bullish) but RSI ~ 50 (Neutral).
Support and Resistance : Nearest Support Zone is $1.25, then $1.00. The nearest Resistance Zone is $1.50, then $1.80.


APEBTC.4HBased on the given market data, it appears that the APE/BTC pair is currently trading in a moderately bearish zone. The current price of 0.000032 is slightly above the 4-hour support level of 0.000031 and below the 4-hour resistance level of 0.000035. This indicates that the market is somewhat volatile and there is a possibility of a price swing in either direction.
The 4-hour RSI (Relative Strength Index) is at 40.51, which suggests that the market is neither overbought nor oversold. This neutral RSI value indicates that there is no clear buying or selling pressure at the moment.
The 4-hour MACD (Moving Average Convergence Divergence) is at 41.0, which is above the signal line and indicates bullish momentum. However, the 1-day MACD is at 49.0, which is relatively high and might indicate overbought conditions, suggesting a potential price correction.
The 7-day RSI is quite low at 29.28, indicating that the market is oversold over a longer timeframe. This could suggest a potential upward price movement in the near future.
In conclusion, the market situation for APE/BTC appears to be mixed. While some indicators suggest a bullish momentum, others indicate a potential price correction. Therefore, investors should proceed with caution and consider their risk tolerance and investment objectives before making a decision. As always, market conditions can change rapidly, and it's essential to stay updated with the latest market trends and news.

Clear Downward TrendIn the weekly timeframe, APE shows a clear downward trend with lower lows and highs. Its recent rise was brief, reversing after meeting significant resistance.
In the daily timeframe, the downtrend continues. Price has reached a critical support (blue zone). If it falls below this, expect further decline. However, a rise above the orange zone (the last downtrend peak) could indicate a trend reversal.

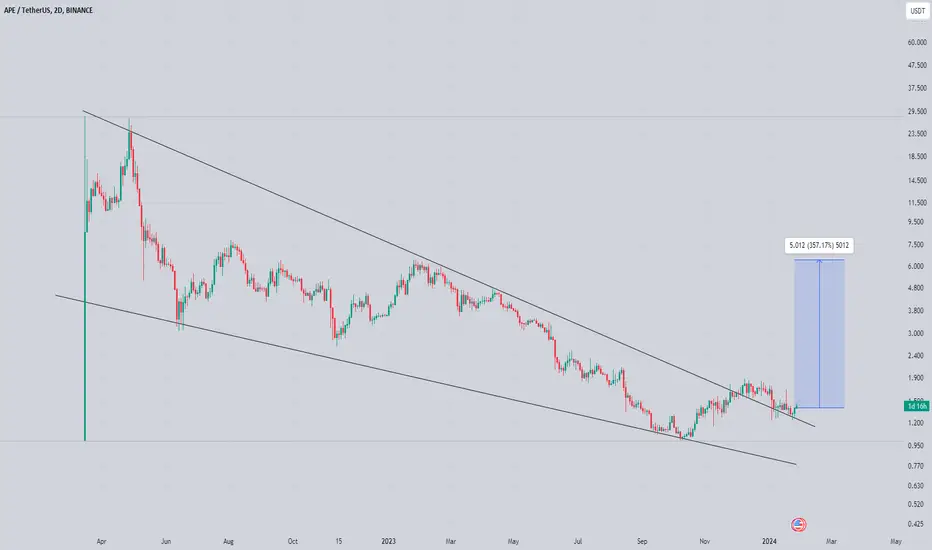
🔥 APE Moonshot Trade: HUGE OpportunityI've been keeping a close eye on APE ever since it launched. It has seen a massive sell-off after the initial launch on Binance, but has potentially stabilized.
As seen on the chart, APE has been forming a long-term falling wedge. In my view, this falling wedge (with a 95% sell-off) could potentially be the slingshot idea that APE has been waiting for. Key indicator is that the resistance of the wedge has been retested as support.
This is a long-term trade, so don't expect the target to be reached within the next year at least.
I'm aware my view on the markets have been largely bearish recently, but that does not mean that there are no bullish opportunities in the market.

seems like ape is ready for reversal seems like has already bottomed out and preparing for solid reversal
falling wedge breakout and retest has already confirmed and seems like ready for bullish rally towards 5$ in coming days
expecting solid recovery in midterm
APE has been a huge disappointment! Will it keep going down?FWB:APE has been going down for months now and it seems like it has more downside. I looking for the H4 FVGs on the charts possibly we can see it going slowly towards there unless we a bullish news for APE.
If this support doesn't hold APE will create new lows.

APE: Approaching ResistanceTrade setup : Trends are mixed and price is at a critical juncture. Following a bearish breakout from a Channel Up pattern, price is trying to break back above 200-day moving average and $1.50 horizontal resistance zone. If it succeeds, it could signal resumption of uptrend with 33% upside potential to $2.00. If it gets rejected, it could signal bearish trend reversal near-term with downside risk to $1.00.
Trend : Neutral on Short-Term basis, Uptrend on Medium-Term basis and Uptrend on Long-Term basis.
Momentum is Mixed as MACD Line is above MACD Signal Line (Bullish) but RSI ~ 50 (Neutral).
Support and Resistance : Nearest Support Zone is $1.00. The nearest Resistance Zone is $1.50, which it broke, then $2.00.

pollback (APE)📊Analysis by AhmadArz:
🔍Entry: 1.514
🛑Stop Loss: 1.538
🎯Take Profit: 1.478
🔗"Uncover new opportunities in the world of cryptocurrencies with AhmadArz.
💡Join us on TradingView and expand your investment knowledge with our five years of experience in financial markets."
🚀Please boost and💬 comment to share your thoughts with us!

APE - DailyApe coin experienced sustained selling pressure for several days. Following a notable rally, sellers have re-entered the market. And the price can fall at least to the resistance zone.

ApeCoin Jumps 10% Following 'Dookey Dash' Free-to-Play GameApeCoin, the esteemed token of Yuga Labs' Bored Ape Yacht Club (BAYC) ecosystem, witnessed an exhilarating surge of over 10% in the wake of the highly anticipated announcement: Dookey Dash, the BAYC-themed game, is set to launch a revolutionary free-to-play edition. The market responded with resounding enthusiasm, propelling ApeCoin ( FWB:APE ) to a current trading value of $1.58, marking a remarkable 10.1% increase in the past 24 hours and a substantial 17.9% surge over the week.
The Unveiling of Dookey Dash's "Unclogged" Edition:
The catalyst behind this meteoric rise was the revelation of Dookey Dash's new "Unclogged" edition, a move that opens the floodgates of public access to this captivating endless runner game. Notably, Dookey Dash was previously an exclusive delight for holders of Bored Ape Yacht Club's Sewer Pass NFTs, but the paradigm is shifting as Yuga Labs introduces a more inclusive gaming experience.
The Implications for ApeCoin Investors:
For ApeCoin enthusiasts and investors alike, this development is more than just a surge in token value; it signifies a new era of accessibility and engagement within the Bored Ape Yacht Club ecosystem. With Dookey Dash breaking free from its NFT constraints, ApeCoin holders now find themselves at the forefront of a burgeoning wave of opportunity.
Unlocking the Gates of Mainstream Adoption:
The move towards a free-to-play edition of Dookey Dash not only democratizes access to the game but also lays the foundation for increased mainstream adoption of the Bored Ape Yacht Club ecosystem. As more individuals join the Dookey Dash community, ApeCoin is poised to become a symbol of innovation and inclusivity within the rapidly evolving world of blockchain gaming.
Community Buzz and Social Momentum:
The announcement has ignited a palpable buzz within the ApeCoin community and the broader cryptocurrency space. Social media platforms are abuzz with discussions on how this move could potentially redefine the landscape of blockchain-based gaming and influence the future trajectory of ApeCoin.
Closing Thoughts:
As ApeCoin continues its upward trajectory, fueled by the excitement surrounding the free-to-play edition of Dookey Dash, the investment landscape for crypto enthusiasts has never been more compelling. The launch of the "Unclogged" edition not only amplifies the utility of ApeCoin within the Bored Ape Yacht Club ecosystem but also positions it as a dynamic player in the larger narrative of blockchain gaming innovation.
In the ever-evolving realm of cryptocurrency, the surge in ApeCoin's value is not just a numerical gain; it represents a transformative moment, urging buyers to seize the opportunity and become part of a community that is shaping the future of decentralized entertainment. As the journey of ApeCoin unfolds, one thing is certain: the excitement is just getting started.

APE : BREAKOUT LONG SIGNAL : THIS MONKEY'S ABOUT TO MAKE A RUN! Refer to previous post.
The entire market is heading up..
I'm not here to earn a degree in crypto waffle. There are enough wafflers. Saturated market..
Buy at current price..

ApeCoin: Double BottomOverview
I recently cancelled one of my other ApeCoin projections where I believed a Three Hills & a Mountain pattern was forming. The second hill became a head and now a bearish Head & Shoulders is in progress. However, I am still bullish on the token because if the H&S is valid and the price is rejected back to $1.00 then this could become a setup for a medium-to-long term double bottom formation.
Head & Shoulders
The H&S can be seen on both the hourly and daily charts. The right shoulder is currently in development with a descending wedge that may squeeze the value back up to a resistance around $1.55. Should the ceiling be strong enough to extinguish any momentum that COINBASE:APEUSD may garner then a correction back to $1.00 is probable.
However, if support is significant enough at this $1.00 level then this will become the second leg for the double bottom pattern.
Double Bottom Projection
There will be plenty of noise in-between that will facilitate short-term trades but I believe a price target near $6 is practical. This is near the same price target of a macro-Cup & Handle projection that I published a few weeks ago.

APE/USDT bullish horizons from demand? 👀🚀 APE Analysis💎 Paradisers, turn your attention to #APEUSDT, which is showing signs of a noteworthy shift from a vital demand level.
💎 Currently, #APE is charting an upward path, hinting at a potential bullish breakout from its current demand zone. We're eyeing a retest of the demand level around $1.292 before it resumes its ascent. Should #APE maintain its ground above this threshold, it sets the stage for an advance towards the significant supply zone at $2.906.
💎 However, should #ApeCoin struggle to hold above the $1.292 level, it may call for a strategic reassessment. In this scenario, we'd consider the possibility of initiating a bullish movement from a lower demand level at $1.137, which holds substantial liquidity.
💎 Monitoring this level is imperative, as breaking below it could trigger a pronounced bearish trend.

APE: Approaching ResistanceTrade setup : Following a bearish breakout from a Channel Up pattern and below 200-day moving average, price could signal bearish trend reversal near-term with downside risk to $1.00.
Pattern : Price was trading in a Channel Up pattern. With emerging patterns, traders who believe the price is likely to remain within its channel can initiate trades when the price fluctuates within its channel trendlines. With complete patterns (i.e. a breakout) – initiate a trade when the price breaks through the channel’s trendlines, either on the upper or lower side. When this happens, the price can move rapidly in the direction of that breakout.
Trend : Downtrend on Short- and Medium-Term basis and Uptrend on Long-Term basis.
Momentum is Bearish but inflecting. MACD Line is below MACD Signal Line and RSI is below 45 but momentum may have bottomed since MACD Histogram bars are rising, which suggests that momentum could be nearing another upswing.
Support and Resistance : Nearest Support Zone is $1.00. The nearest Resistance Zone is $1.50 (previous support), then $2.00.

APE: Channel Up BreakoutTrade setup : Bearish breakout from a Channel Up pattern could signal bearish trend reversal near-term with downside risk to $1.00.
Pattern : Price was trading in a Channel Up pattern. With emerging patterns, traders who believe the price is likely to remain within its channel can initiate trades when the price fluctuates within its channel trendlines. With complete patterns (i.e. a breakout) – initiate a trade when the price breaks through the channel’s trendlines, either on the upper or lower side. When this happens, the price can move rapidly in the direction of that breakout.
Trend : Downtrend on Short- and Medium-Term basis and Uptrend on Long-Term basis.
Momentum is Bearish (MACD Line is below MACD Signal Line, and RSI is below 45).
Support and Resistance : Nearest Support Zone is $1.00. The nearest Resistance Zone is $1.50 (previous support), then $2.00.

APE: Channel Up BreakoutTrade setup : Bearish breakout from a Channel Up pattern could signal bearish trend reversal near-term with downside risk to $1.00.
Pattern : Price was trading in a Channel Up pattern. With emerging patterns, traders who believe the price is likely to remain within its channel can initiate trades when the price fluctuates within its channel trendlines. With complete patterns (i.e. a breakout) – initiate a trade when the price breaks through the channel’s trendlines, either on the upper or lower side. When this happens, the price can move rapidly in the direction of that breakout.
Trend : Downtrend on Short-Term basis, Neutral on Medium-Term basis and Uptrend on Long-Term basis.
Momentum is Bearish (MACD Line is below MACD Signal Line, and RSI is below 45).
Support and Resistance : Nearest Support Zone is $1.50, which it broke, then $1.00. The nearest Resistance Zone is $2.00, then $2.50.

#APEIn the H4, it is moving in an ascending channel, which is the specified trading range. If a rejection candle or return candle is placed in the green box, you can enter into a sale transaction up to the bottom of the channel.
