#APE/USDT#APE
The price is moving within a descending channel on the 1-hour frame, adhering well to it, and is heading for a strong breakout and retest.
We are seeing a bounce from the lower boundary of the descending channel, which is support at 0.5060.
We have a downtrend on the RSI indicator that is about to be broken and retested, supporting the upward trend.
We are looking for stability above the 100 moving average.
Entry price: 0.5386
First target: 0.5528
Second target: 0.5720
Third target: 0.5887
APEBTC

#APE/USDT#APE
The price is moving within a descending channel on the 1-hour frame, adhering well to it, and is heading for a strong breakout and retest.
We are seeing a bounce from the lower boundary of the descending channel, which is support at 0.4548.
We have a downtrend on the RSI indicator that is about to be broken and retested, supporting the upward trend.
We are looking for stability above the 100 moving average.
Entry price: 0.4875
First target: 0.4718
Second target: 0.4794
Third target: 0.4875

#APE/USDT#APE
The price is moving within a descending channel on the 1-hour frame, adhering well to it, and is heading for a strong breakout and retest.
We are seeing a bounce from the lower boundary of the descending channel, which is support at 0.4040.
We have a downtrend on the RSI indicator that is about to be broken and retested, supporting the upward trend.
We are looking for stability above the 100 moving average.
Entry price: 0.4122
First target: 0.4223
Second target: 0.4330
Third target: 0.4464

APE Analysis | Lost in the Jungle or Making a Comeback? (1D)The larger-degree APE pattern appears to be a large symmetrical triangle, and we are currently in the G wave of this pattern. The G wave is bearish, and within the G wave, we can also observe a smaller-degree symmetrical triangle.
It seems we are nearing the final leg of this pattern, and we expect one more drop from the red box. If the price reaches the green zone, we may have a low-risk opportunity to enter a buy position.
Potential targets are marked on the chart.
A daily candle closing below the invalidation level would invalidate this outlook.
For risk management, please don't forget stop loss and capital management
When we reach the first target, save some profit and then change the stop to entry
Comment if you have any questions
Thank You

#APE/USDT Ready to go higher#APE
The price is moving in a descending channel on the 1-hour frame and sticking to it well
We have a bounce from the lower limit of the descending channel, this support is at 0.950
We have a downtrend on the RSI indicator that is about to be broken, which supports the rise
We have a trend to stabilize above the 100 moving average
Entry price 1.10
First target 1.28
Second target 1.52
Third target 1.73

APEUSDT - Huge Potential LongI love this setup here for a long entry. Massive volume is coming into APE, which with the launch of Apechain has a huge amount of potential. If you haven't checked out their site www.apechain.com you will see what I'm talking about.

APE will be bullish againThe APE correction seems to have been a diamond diametric as we are now at the end of the G wave.
This correction was wave B. Expect a C wave for APE.
Wave C will be bullish.
Closing a daily candle below the invalidation level will violate this analysis.
For risk management, please don't forget stop loss and capital management
Comment if you have any questions
Thank You

#APE (SPOT- Investing ) entry (0.60 - 0.830). SL (0.475)entry range ( 0.60 - 0.830)
SL .Daily close below (0.475)
**NOTES***
1* this coin is very heavy, it may take long time to achieve the targets and the targets is for the BULL RUN
2* collect the coin slowly in the entry range ( do not all in one time in one price )
***********************************************************
BINANCE:APEUSDT
#APE
#APEUSDT
#APEUSD
#swingtrade
#shortterminvestment
#ALTCOIN
#Cryptotading
#cryptoinvesting
#investment
##trading
#cryptocurrencytrading
#bitcoininvestments
#Investing_Coins
#Investingcoins
#Crypto_investing
#Cryptoinvesting
**** #Manta ,#OMNI, #DYM, #AI, #IO, #XAI , #ACE #NFP #RAD #WLD #ORDI #BLUR #SUI #Voxel #AEVO #VITE #APE ****
#bitcoin
#BTC
#BTCUSDT

#APE/USDT#APE
The price is moving in a downward channel on the 12-hour frame upwards and is expected to continue
We have a trend to stabilize above the moving average 100 again
We have a downward trend on the RSI indicator that supports the rise by breaking it upwards
We have a support area at the lower limit of the channel at a price of 1.00
Entry price 1.095
First target 1.34
Second target 1.52
Third target 1.70

APE: stop buy📊Analysis by AhmadArz:
🔍Entry: 1.315
🛑Stop Loss: 1.257
🎯Take Profit: 1.345 -1.419 -1.536
🔗"Uncover new opportunities in the world of cryptocurrencies with AhmadArz.
💡Join us on TradingView and expand your investment knowledge with our five years of experience in financial markets."
🚀Please boost and💬 comment to share your thoughts with us!

#APE/USDT#APE
The price is moving in a bearish channel on a 4-hour frame and is adhering to it well. The price has rebounded from the green zone and is expected to retest it at the price of $1.0
We have a tendency to stabilize above the Moving Average 100
We have an uptrend on the RSI indicator to support the rise
Entry price is 1.00
The first goal is 1.32
The second goal is 1.50
The third goal is 1.75

APE ANALYSIS (1D)APE appears to be forming a large triangle.
Now it seems that the big wave C is over and we are in the waves of wave D.
From the green range, I expect a trend change for APE.
The targets are clear on the chart.
Closing a daily candle below the invalidation level will violate the analysis
For risk management, please don't forget stop loss and capital management
When we reach the first target, save some profit and then change the stop to entry
Comment if you have any questions
Thank You

#APE/USDT#APE
The price has been moving in a down channel since July 2022
The price adhered to the boundaries of that channel perfectly
Now we have an upward trend on two levels
Current price 1.70
First goal 3.44
Second goal 5.14

APE LOOKS BULLISHThe structure is such that it is Boolean. We have an ascending iCH and iBOS on the chart and the candles have broken the trigger line.
In the upper part of the chart, we have a liquidity pool that the price seems to be trying to sweep.
It can be pumped while maintaining the green range.
Closing a daily candle below the invalidation level will violate the analysis
For risk management, please don't forget stop loss and capital management
Comment if you have any questions
Thank You

APE UPDATE (4H)This analysis is an update of the analysis that you can see at the bottom of this page, in the related analysis section
APE has some weakness in momentum. With recent data, its wave scenario has become more clear.
It seems to be inside a diametric that is now in the F wave of this diametric.
Wave F is expected to end in the green range and then APE will enter a bullish wave G.
TP is marked on the picture.
Closing a daily candle below the green range will violate the analysis
For risk management, please don't forget stop loss and capital management
Comment if you have any questions
Thank You

APE Has broken above 1.850APE Has broken above 1.850, the pullback might be very short due to the strong Bullish engulfing candle.
🔵Entry Zone 1.769 - 1.835
🔴SL 1.6361
🟢TP1 1.9198
🟢TP2 2.1440
🟢TP3 2.3661
Risk Warning
Trading Forex, CFDs, Crypto, Futures, and Stocks involve a risk of loss. Please consider carefully if such trading is appropriate for you. Past performance is not indicative of future results.
If you liked our ideas, please support us with your likes 👍 and comments.

APEBTC.4HBased on the given market data, it appears that the APE/BTC pair is currently trading in a moderately bearish zone. The current price of 0.000032 is slightly above the 4-hour support level of 0.000031 and below the 4-hour resistance level of 0.000035. This indicates that the market is somewhat volatile and there is a possibility of a price swing in either direction.
The 4-hour RSI (Relative Strength Index) is at 40.51, which suggests that the market is neither overbought nor oversold. This neutral RSI value indicates that there is no clear buying or selling pressure at the moment.
The 4-hour MACD (Moving Average Convergence Divergence) is at 41.0, which is above the signal line and indicates bullish momentum. However, the 1-day MACD is at 49.0, which is relatively high and might indicate overbought conditions, suggesting a potential price correction.
The 7-day RSI is quite low at 29.28, indicating that the market is oversold over a longer timeframe. This could suggest a potential upward price movement in the near future.
In conclusion, the market situation for APE/BTC appears to be mixed. While some indicators suggest a bullish momentum, others indicate a potential price correction. Therefore, investors should proceed with caution and consider their risk tolerance and investment objectives before making a decision. As always, market conditions can change rapidly, and it's essential to stay updated with the latest market trends and news.

APE - DailyApe coin experienced sustained selling pressure for several days. Following a notable rally, sellers have re-entered the market. And the price can fall at least to the resistance zone.

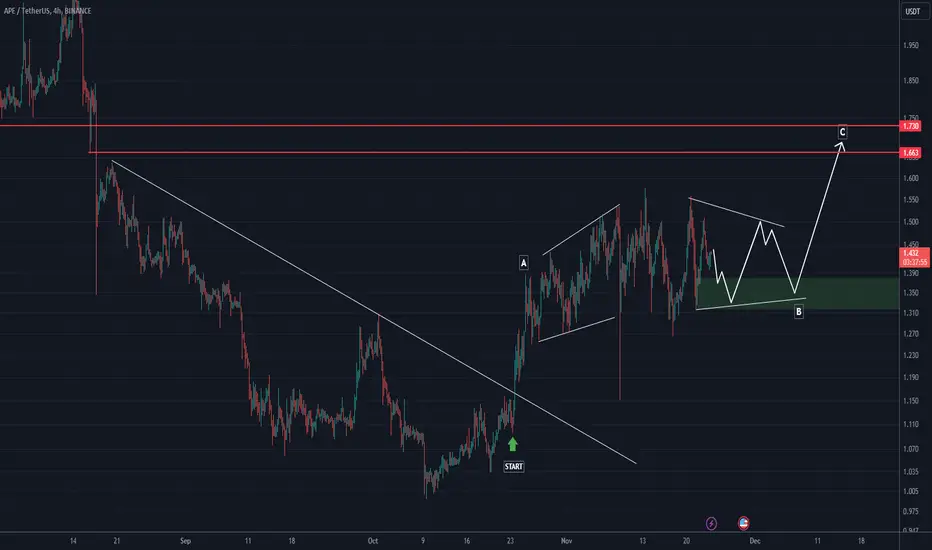
APE ANALYSIS (4H)APE's uptrend looks weak, but the price may rise. From where I put STRAT on the chart, it looks like an ascending wave has started which is ABC.
We seem to be in wave B now. Wave C can move up to two red lines.
For risk management, please don't forget stop loss and capital management
Comment if you have any questions
Thank You
#APE: A Gateway to Promising Returns in the Upcoming Market!"In the vast landscape of the daily time frame, #APE has been navigating through the twists and turns of a descending channel for a significant 269 days. It's a journey that's kept both bulls and bears on their toes.
To ignite a potential surge, the bulls face a formidable challenge: breaking free from the grip of this descending channel. It's a pivotal moment that could unlock the door to significant movements and set the stage for an exciting chapter in #APE's story. The crypto world awaits with bated breath for the outcome!
In the realm of the 12-hour time frame, we find ourselves on the cusp of something extraordinary—a potential APE breakout from the clutches of a falling wedge pattern. Yet, we're not in the clear just yet; a confirmation candle stands as our sentinel on this thrilling journey.
Adding to the intrigue, the RSI chart unveils a captivating bullish divergence, hinting at the dawn of something remarkable. What's in store? Well, according to the pattern's technical script, we can anticipate a whopping 75% bounce, leading us toward the alluring resistance levels of $1.49 and a tantalizingly close $1.8. It's an adventure that promises both challenge and reward and the crypto world beckons with excitement!
This chart is likely to help you make better trade decisions if it does consider upvoting it.
I would also love to know your charts and views in the comment section.
Thank you

APE still looks bearish (1D)Do not enter a short position without a sell setup.
By checking the status of this symbol, it seems that we are in a symmetrical pattern and the fall continues.
If the red zone is broken, this analysis will be violated.
I have marked the targets on the chart

APE NEW UPDATE (1D)With the absence of heavy rejection in this branch and the formation of supporting candles, this apt scenario is valid. The previous scenario is cancellation.
By saving the green zone, it can climb up to the red zone

APE IS VERY BEARISHHi, dear traders. how are you ? Today we have a viewpoint to SELL/SHORT the APE symbol.
For risk management, please don't forget stop loss and capital management
When we reach the first target, save some profit and then change the stop to entry
Comment if you have any questions
Thank You
