ApeCoin ($APE) Skyrockets 118% After ApeChain LaunchApeCoin ( GETTEX:APE ), the native token of the Bored Ape Yacht Club ecosystem, has experienced an explosive price surge, doubling in value over the weekend and hitting $1.5 for the first time since April. This surge is driven by the debut of ApeChain, a Layer-3 network built on Arbitrum Orbit, which has drawn massive attention from investors and traders alike. However, while the fundamentals behind this price movement look strong, technical indicators suggest caution as the token enters overbought territory.
The ApeChain Launch
The launch of ApeChain is the primary driver behind ApeCoin’s impressive 118% rally. ApeChain is a Layer-3 blockchain built on Arbitrum Orbit, and it has introduced several key features that have enhanced its appeal:
- Automatic Yield Mode: ApeChain simplifies passive income for ApeCoin holders, allowing them to earn rewards without the need for manual staking. This innovative feature quickly boosted the user base from 83 to over 3,000 within hours of the launch.
- Cross-Network Bridge: ApeChain also debuted a cross-network bridge that enables seamless transfers between ApeCoin (APE), Wrapped Ethereum (WETH), USD Coin (USDC), Tether (USDT), and Dai (DAI) across the ApeChain, Ethereum, and Arbitrum networks. This expanded utility makes ApeCoin more attractive for cross-chain applications, especially within Yuga Labs’ ecosystem, which includes popular NFT collections like the Bored Ape Yacht Club.
The immediate impact of ApeChain’s debut was a massive spike in trading volume, with Camelot DEX reporting over $5 million in the first three hours. ApeCoin’s on-chain volume followed suit, increasing by nearly 3000% and nearing the $1 billion mark. Such significant gains were echoed in the price, as ApeCoin surged past $1.50, a level it hadn’t touched since April.
Market Response and Investor Sentiment
ApeChain’s launch was met with enthusiasm across the market, with investors excited by the token’s potential utility within the rapidly expanding Yuga Labs ecosystem. ApeCoin ( GETTEX:APE ) also upgraded its smart contract to adopt LayerZero’s Omnichain Fungible Token (OFT) standard, enhancing its interoperability across networks.
This rally was further fueled by the Fear of Missing Out (FOMO) effect, as ApeCoin ( GETTEX:APE ) surpassed a $1 billion market cap, drawing in even more buyers. With ApeChain’s features and the integration of cross-chain transfers, ApeCoin’s potential use cases within the NFT and DeFi spaces have significantly expanded, creating a bullish narrative around the token.
Technical Outlook: Bullish or Overbought?
Despite the strong fundamental narrative, technical indicators suggest caution. At the time of writing, ApeCoin (APE) is trading at $1.55, up 4.48% on the day, and remains well above the recent $1.33 support level. While ApeCoin ( GETTEX:APE ) has successfully broken out of the downward trendline that had constrained its price since June, the Relative Strength Index (RSI) is flashing warning signs.
ApeCoin ( GETTEX:APE ) is in overbought territory, with an RSI above 88, signaling the possibility of a trend reversal or at least a temporary cooling-off period. When an asset is this overbought, profit-taking is likely, leading to increased selling pressure.
ApeCoin ( GETTEX:APE ) is trading above its key moving averages, further cementing its bullish momentum. However, traders should be cautious as a failure to maintain this momentum could trigger a pullback.
If GETTEX:APE can maintain its bullish momentum and stay above the $1.47 resistance level, it could attempt to breach the next psychological barrier of $2.00. However, if a reversal occurs, the first key support level is at $1.33, followed by $1.20.
Potential Risks and Liquidation Levels
While ApeCoin ( GETTEX:APE ) has performed well, there are risks to the upside. CoinGlass data suggests that liquidation levels for ApeCoin are at $1.0178, where a further price rise could lead to the liquidation of $2.59 million in short positions. This could drive the price higher in the short term, but analysts warn that such a move could also create additional selling pressure as traders close out their short positions.
Moreover, the performance of Bitcoin (BTC) could impact ApeCoin’s trajectory. If BTC experiences a correction, the broader market sentiment could turn bearish, putting additional pressure on ApeCoin ( GETTEX:APE ).
Summary
ApeCoin ( GETTEX:APE ) has made significant strides in both its utility and price performance, primarily driven by the ApeChain launch. The introduction of Automatic Yield Mode, cross-network bridges, and LayerZero integration has unlocked new potential for ApeCoin ( GETTEX:APE ) within the broader crypto ecosystem. However, with the RSI indicating overbought conditions, traders should remain cautious as a pullback could be imminent.
In the short term, GETTEX:APE is riding high on bullish momentum, but the looming risks of liquidation and market correction suggest that investors should monitor technical levels closely before making any decisions.
Apecoin

ApeCoin APE price gave a ray of hope, for the first time in 2.5yWhat happened in #ApeCoin that the price gained +160% in 3 days?)
In principle, OKX:APEUSDT still has the potential to rise to $2, and then "they" can draw an inverted head and shoulders. Although, it's a bit scary to "get long" before $0.85.
At the #SUIUSDT chart has clearly worked out this pattern.
Another concern is how thin the crypto market is: a little effort and you can pump the asset so much that #APE which has been in a stable downward trend for more than 2.5 years, “jumped” to 4th place in terms of trading volume, right after CRYPTOCAP:BTC , CRYPTOCAP:ETH and CRYPTOCAP:SOL
_____________________
Did you like our analysis? Leave a comment, like, and follow to get more

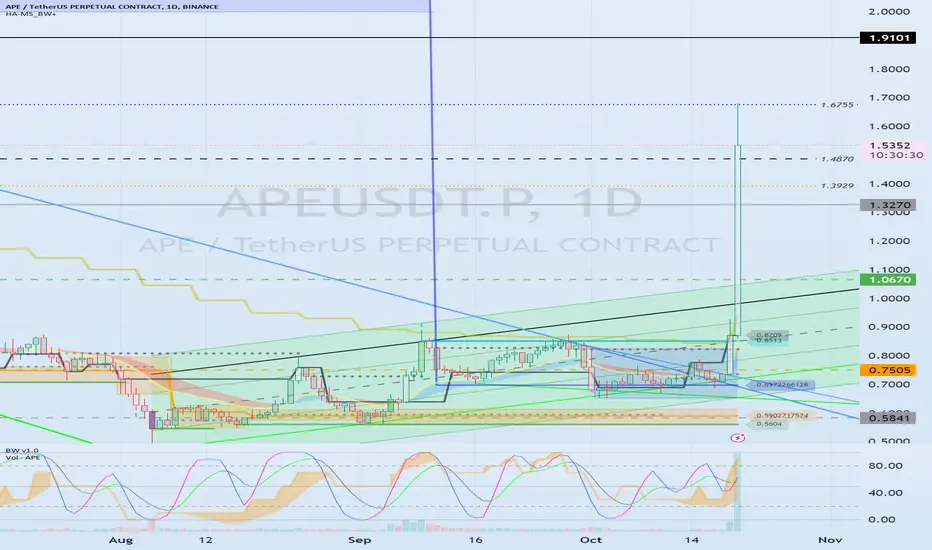
APEUSDT (ApeCoin) Updated till 20-10-24APEUSDT (ApeCoin) Daily timeframe range. we can see a massive pump today got upto several level at once. 1.549 is a hold up for now. if volume stays it can break and a clean close above 1.549 can push it further. recent retrace point at 1.137.

Why Support and Resistance Points Are Important
Hello, traders.
If you "Follow", you can always get new information quickly.
Please click "Boost".
Have a nice day today.
-------------------------------------
(APEUSDT.P 1M chart)
Usually, the arrangement of candles is used to indicate support and resistance points.
Basically, indicators are used to indicate support and resistance points.
However, I feel like support and resistance points are needed in the 1.9101-6.7780 range.
So, there is a possibility that support and resistance points are drawn near where the fingers are pointing.
The price is currently under 1.9101, so let's check it out on another time frame chart.
In any case, the point to watch is whether it can rise after receiving support in the 1.3270-1.9101 section.
-
(1W chart)
When drawing support and resistance points using indicators, it is best to draw indicators that are currently marked with candles.
This is because it means that the current point is acting as support and resistance.
Other than that, you can mark indicators that are thought to have a longer horizontal line than other horizontal lines.
If you check the chart above, I think you'll understand what I mean.
Since the important support and resistance points are indicators that are currently marked with candles, you can create a trading strategy targeting the corresponding horizontal lines.
The sections marked as Support and Resistance on the chart correspond to those.
You can think of the remaining lines as lines that can be used for detailed strategies that allow you to conduct split transactions when conducting transactions.
In that sense, the 1.4870 point can be used for detailed trading strategies, that is, response strategies.
Accordingly, you can proceed with buying or selling.
-
(1D chart)
The support and resistance points to be used for detailed trading strategies are indicated in the 1.320-1.9101 section.
That is, the points 1.3929 and 1.6755 are applicable.
These two points correspond to the HA-Low and HA-High indicator points.
-------------------------------------------------
If you have indicated support and resistance points on the 1M, 1W, and 1D charts as above, you can mark them according to the importance of the support and resistance points and create chart analysis or trading strategies for them.
Important support and resistance points are
1st: 0.5841-0.7505
2nd: 1.0670
3rd: 1.3270
4th: 1.9101-2.1090
You can use the points or sections above to create chart analysis or trading strategies.
When marking support and resistance points, do not draw them while thinking about chart analysis or trading strategies.
The reason is that if you do so, you will likely mark support and resistance points while reflecting your subjective thoughts and psychology.
Therefore, when marking support and resistance points, it is important to focus only on the arrangement of candles without thinking about anything else.
-
Have a good time.
Thank you.
--------------------------------------------------
- Big picture
It is expected that a full-scale uptrend will begin when it rises above 29K.
The section expected to touch the next bull market is 81K-95K.
#BTCUSD 12M
1st: 44234.54
2nd: 61383.23
3rd: 89126.41
101875.70-106275.10 (overshooting)
4th: 134018.28
151166.97-157451.83 (overshooting)
5th: 178910.15
These are points where resistance is likely to occur in the future.
We need to check if these points can be broken upward.
We need to check the movement when this section is touched because I think a new trend can be created in the overshooting section.
#BTCUSD 1M
If the major uptrend continues until 2025, it is expected to start forming a pull back pattern after rising to around 57014.33.
1st: 43833.05
2nd: 32992.55
-----------------
APE COIN PRICE ANALYSIS AND POSSIBLE TRADE SETUP !!GETTEX:APE Coin Update !!
In last 3 days price almost surge around 100%+ & currently look in overbought zone 🚨
Small dip expected from its liquidation zone or from its feb key levels ✅
But without SL Don't Build any trade on it ... Manipulation is too high 🚨
Also Don't Use High Fund or High Leverage ✅
Without confirmation on Lower tf's 1h, 30m & 15m don't build any side trade on it 🚨

APE. Does not look good.Structurally, the chart shows nothing. A 98% drop and price movement in a global downward channel only indicates that the bubble is still deflating. However, there is one consolation for APE holders - the sideways movement within the channel has been going on for over 100 days, which may indirectly indicate the formation of a bottom, BUT... Overbought by RSI, provided that the asset is not experiencing an upward local movement, does not look very good.

APE is about to blow up.APE (NFT) is about to blow up.
Take The next few weeks and milk APE.
Use Intraday techniques with extreme risk management. Keep DCA marks ready if market crashes, your Intrady will turn into a perfect swing.
What do you guys think?

APECOINGETTEX:APE 🔵🦍
After analyzing #ApeCoin from multiple angles, I believe the following scenario aligns best with my perspective:
A potential buying opportunity around ~$0.42 level.
However, if the price free falls below ~$0.40 without any bullish reaction, the idea would be invalid.

APE/USDT Breakout Alert! Is need retest and continue bullish!Yello, Paradisers! Are you ready for a potential breakout or a steep drop? Let’s dive into #APEUSDT, where we’re seeing some significant action that could make or break your next trade.
💎#APE has shown a bullish sign after successfully breaking out of the falling wedge pattern and then reversing the short-term trend by breaking the previous Lower High (LH). This suggests that a shift toward a bullish movement is underway. Currently, the price is likely to retest either the trendline or the demand zone around $0.63, which aligns with a key Fibonacci retracement level at $0.69 - $0.63. If APE can find support and rebound from this level, there’s a high probability that the upward movement will continue toward the key resistance area.
💎This resistance is located around the $0.993 level, which happens to be APE’s previous bottom. A breakout above this level could trigger bullish momentum in the mid-term, with the potential for APE to reach its major resistance target.
💎However, it’s not all bullish optimism. If the price fails to rebound from the $0.63 - $0.55 demand zone and breaks below, we could be in for some trouble. In that case, the highest probability is that APE will revisit the key support area around $0.43. This zone marks the previous bottom for APE, so it’s critical that the price holds here to maintain the bullish scenario.
💎A daily close below $0.43 would invalidate the bullish outlook. A break below this level would signal a new lower low, pushing APE into a deeper decline, creating a fresh bottom.
Remember, staying disciplined and following clear strategies are essential in these volatile times.
MyCryptoParadise
iFeel the success🌴

Will #APE See a Breakout or Keep Falling? Key Levels to WatchYello, Paradisers! Are you ready for the next big move in the #Apecoin? Let’s dive into #APEUSDT analysis, where things are getting intense:
💎#APE is currently showing signs of a potential bullish continuation from a crucial Bullish Order Block (OB) at $0.563. We’ve been watching #ApeCoin navigate a descending channel.
💎Recently, it’s been making a serious attempt to break above this formation, gaining momentum from that Bullish OB. If this upward push holds, we could be in for a powerful bullish surge.
💎But here's the catch— GETTEX:APE needs to break through the key resistance level at $0.788 to confirm this bullish scenario. Should this happen, we could witness a significant rally, with the first target pegged at the Bearish OB around $1.03. This is where things could get really exciting.
💎However, let's not get ahead of ourselves. If the momentum fizzles out near this demand zone, we could see a pullback to the lower demand area at $0.473. A daily close below this support zone would flip the script, invalidating our bullish outlook and potentially leading to further declines.
Stay disciplined, patient, and ready to adapt to whatever the market throws our way.
MyCryptoParadise
iFeel the success🌴

APE is about to go APE SHIZZZTHE PUMP IS COMING IMO!!!
I have taken 99% of my funds out of crypto but now I am rotating cash in.
BUY low sell at $10ish???
NOT FINANCIAL ADVICE!!!
If you long it from here and aren't spot buying I would bet 10k they wipe yo ass out. Leverage ain't your friend. I buy spot and chill. Don't think you are going to get rich quick. You'll end up sitting on a

#APE/USDT#APE
Our price is moving downwards on a 1-hour frame and is about to break it upward in stages
We have a bounce from the lower border of the channel from the support area in green at 0.66
We have a tendency to stabilize above the Moving Average 100
Entry price is 0.690
The first goal is 0.778
The second goal is 0.827
Third goal 0875

APE/USDT Investment UpdateHello everyone. Bitcoin went against the majority, including myself, and didn't drop to 40-50k as I anticipated.
➖ I had to correct my mistake and bought APE/USDT with 100% of my portfolio.
➖ Based on the orders, the first target is $1.80-$1.90.
➖ The second target is closer to $5, and the long-term target could be $25-$50 considering the launch of the Otherside game. As we approach $1.80-$1.90, I will likely close half of the position and diversify my portfolio with other cryptocurrencies.
#ape #Apecoin #bitcoin #otherside

APE: Will It Finally Stop Bleeding? Bullish Divergence!APE came on the market with a bang, but has been severely underperforming Bitcoin (and most alts) since it's inception on Binance. Very disappointing price action for holders.
Nevertheless, there's a small chance that APE has bottomed. On the weekly, there's a strong indication for Bullish Divergence, which could lead to a sizeable move in the coming weeks and months.
I'm keeping a tight stop loss and a target at 5$. This will result in a trade with a very good risk-reward of over 23.

APE - W pattern?APE appears to be one of the best assets in crypto from a risk-reward perspective and has been in a macro accumulation phase for a considerable period.
The $1 support, which has become resistance, is very relevant for the upcoming period.
If APE manages to turn the $1 resistance back into support, we have confirmation that the price below $1 in the recent period was a fake-out.
On the other hand, at the macro level, APE seems to be forming a W pattern . Taking the macro support and resistance (accumulation) as the price objective and placing it above the $2.5 resistance indicates that we can reach $6.4.
Therefore, if we have confirmation that $1 is becoming support again and the recent movement below it was a fake-out, we have a potential 5x reward .
An invalidation of the fake-out would be if the price falls below $0.84 with a full body and consolidates below.

APE: Channel Down BreakoutTrade setup : Price broke out of Channel Down pattern, which could signal a bullish trend reversal with +15% upside potential to $1.50. Stop Loss (SL) level at $1.09 (below prior swing low). This is a riskier trade setup because it’s a trend reversal not a trend continuation setup. It’s against the overall downtrend.
Pattern : Price was trading in a Channel Down pattern. With complete patterns (i.e. a breakout) – initiate a trade when the price breaks through the channel’s trendlines, either on the upper or lower side. When this happens, the price can move rapidly in the direction of that breakout. Learn to trade chart patterns in Lesson 8.
Trend : Neutral on Short-Term basis and Downtrend on Medium- and Long-Term basis.
Momentum is Mixed as MACD Line is above MACD Signal Line (Bullish) but RSI ~ 50 (Neutral).
Support and Resistance : Nearest Support Zone is $1.25, then $1.00. The nearest Resistance Zone is $1.55 (previous support), then $1.85.

#APE/USDT Trading at the Bottom. 2500% to reach the ATH!Welcome to this quick trade setup, everyone.
First of all, I request you to follow me if you want to leverage the upcoming altcoin season of 2024. I will be dropping the best 30 trade setups for this bull run. In 2021, I posted 28 altcoins, 18 of which achieved 10x to 30x returns, 5 did 5x to 8x, while a few didn't have a significant run. You can check my previous charts for the results.
I will be doing that again, so stay with me.
Let's get straight to this chart. APE is trading right around the bottom as we speak. The all-time low for APE is $1, and it is currently 24% up from there.
Is it a good investment? APE hasn't had a significant run yet. To achieve the previous ATH, it needs to pump almost 2500%+. Is it a good bet? Considering the technical analysis, yes.
I am adding a small bag here and will DCA all the way to $0.80. The target is $15 to $27.
But always DYOR, this is not financial advice.
If you want more trade setups, please hit the like button to support my content.
Thank you.
#PEACE

APE: Channel Down BreakoutTrade setup : Price broke out of Channel Down pattern but we wait for confirmation: break above $1.32 key level. If so, it could signal a bullish trend reversal with +15% upside potential to $1.50. Stop Loss (SL) level at $1.09 (below prior swing low). This is a riskier trade setup because it’s a trend reversal not a trend continuation setup. It’s against the overall downtrend.
Pattern : Price was trading in a Channel Down pattern. With complete patterns (i.e. a breakout) – initiate a trade when the price breaks through the channel’s trendlines, either on the upper or lower side. When this happens, the price can move rapidly in the direction of that breakout. Learn to trade chart patterns in Lesson 8.
Trend : Downtrend across all time horizons (Short- Medium- and Long-Term).
Momentum is Mixed as MACD Line is above MACD Signal Line (Bullish) but RSI < 45 (Bearish).
Support and Resistance : Nearest Support Zone is $1.25, which it broke, then $1.00. The nearest Resistance Zone is $1.55 (previous support), then $1.85.

APE: Channel Down BreakoutTrade setup : Price broke out of Channel Down pattern but we wait for confirmation: break above $1.32 key level. If so, it could signal a bullish trend reversal with +15% upside potential to $1.50. Stop Loss (SL) level at $1.09 (below prior swing low). This is a riskier trade setup because it’s a trend reversal not a trend continuation setup. It’s against the overall downtrend.
Pattern : Price was trading in a Channel Down pattern. With complete patterns (i.e. a breakout) – initiate a trade when the price breaks through the channel’s trendlines, either on the upper or lower side. When this happens, the price can move rapidly in the direction of that breakout. Learn to trade chart patterns in Lesson 8.
Trend : Downtrend across all time horizons (Short- Medium- and Long-Term).
Momentum is Mixed as MACD Line is above MACD Signal Line (Bullish) but RSI < 45 (Bearish). MACD Histogram bars are declining, which suggests that momentum is weakening.
Support and Resistance : Nearest Support Zone is $1.25, which it broke, then $1.00. The nearest Resistance Zone is $1.55 (previous support), then $1.85.

APE UTAD to $2.50Ape is approaching the top of this range again - it still hasn't quite reached the 1.618 from waves 1 + 3. As most Elliott Wave enthusiasts will tell you, you can normally find the wave 5 target by pulling fib extensions on wave 1+3. This has been the case for many of the other alts as well, as they all approach major macro wave 5 targets. Look for APE to take out the current highs into that 1.618 to form the UTAD here

SasanSeifi 💁♂Will We See a Break Above $1.32❓
Hi there!
Taking a look at the 4-hour timeframe, the overall trend has been oscillating within the price range of $1 to $1.30. The price has recently bounced off the $1.20 demand zone and is currently trading in a range of around $1.28.
In the short term, there is a possibility of a HIGH above the previous high of $1.30 and growth to the liquidity zone target of $1.38/$1.50. I expect the price to see growth after ranging or making a minor correction if confirmed. The key support zone is $1.20.
Conversely, if the price breaks below the LOW and settles below $1.20, further correction is likely.
Remember, this isn't financial advice! Always do your research before making any trades.
Sure, if you have any more questions or need further clarification, feel free to ask. I'm here to help!✌
if you found my analysis helpful, I would appreciate it if you could show your support by liking and commenting. Thank you!🙌

APE: Channel Down BreakoutTrade setup : Price broke out of Channel Down pattern but we wait for confirmation: break above $1.32 key level. If so, it could signal a bullish trend reversal with +15% upside potential to $1.50. Stop Loss (SL) level at $1.09 (below prior swing low). This is a riskier trade setup because it’s a trend reversal not a trend continuation setup. It’s against the overall downtrend.
Pattern : Price was trading in a Channel Down pattern. With complete patterns (i.e. a breakout) – initiate a trade when the price breaks through the channel’s trendlines, either on the upper or lower side. When this happens, the price can move rapidly in the direction of that breakout. Learn to trade chart patterns in Lesson 8.
Trend : Downtrend across all time horizons (Short- Medium- and Long-Term).
Momentum is Mixed as MACD Line is above MACD Signal Line (Bullish) but RSI < 45 (Bearish).
Support and Resistance : Nearest Support Zone is $1.25, which it broke, then $1.00. The nearest Resistance Zone is $1.55 (previous support), then $1.85.

APE: Channel Down BreakoutTrade setup : Price broke out of Channel Down pattern but we wait for confirmation: break above $1.25 key level. If so, it could signal a bullish trend reversal with +20% upside potential to $1.50. Stop Loss (SL) level at $1.09 (below prior swing low). This is a riskier trade setup because it’s a trend reversal not a trend continuation setup. It’s against the overall downtrend.
Pattern : Price is trading in a Channel Down pattern. With emerging patterns, traders who believe the price is likely to remain within its channel can initiate trades when the price fluctuates within its channel trendlines. With complete patterns (i.e. a breakout) – initiate a trade when the price breaks through the channel’s trendlines, either on the upper or lower side. When this happens, the price can move rapidly in the direction of that breakout. Learn to trade chart patterns in Lesson 8.
Trend : Downtrend across all time horizons (Short- Medium- and Long-Term).
Momentum is Mixed as MACD Line is above MACD Signal Line (Bullish) but RSI < 45 (Bearish).
Support and Resistance : Nearest Support Zone is $1.25, which it broke, then $1.00. The nearest Resistance Zone is $1.55 (previous support), then $1.85.
