ApeCoin Quick Update —Moving Next#APE
The price is moving within a descending channel on the 1-hour frame, adhering well to it, and is heading for a strong breakout and retest.
We have a bounce from the lower boundary of the descending channel, this support at 0.5827.
We have a bearish trend on the RSI indicator that is about to be broken and retested, supporting the upside.
There is a major support area in green at 0.5600, which represents a strong basis for the upside.
Don't forget a simple thing: ease and capital.
When you reach the first target, save some money and then change your stop-loss order to an entry order.
For inquiries, please leave a comment.
We have a trend to hold above the 100 Moving Average.
Entry price: 0.6000.
First target: 0.6194.
Second target: 0.6378.
Third target: 0.6612.
Don't forget a simple thing: ease and capital.
When you reach the first target, save some money and then change your stop-loss order to an entry order.
For inquiries, please leave a comment.
Thank you.
APEUSD

APE coin cup & Handle. This chart shows good potential as the #Alts start to take back center stage form #BTC
neckline around 79c
could be a triple if Alts can sustain an uptrend.
it's been a while
but the time is now
if it is to be the case.

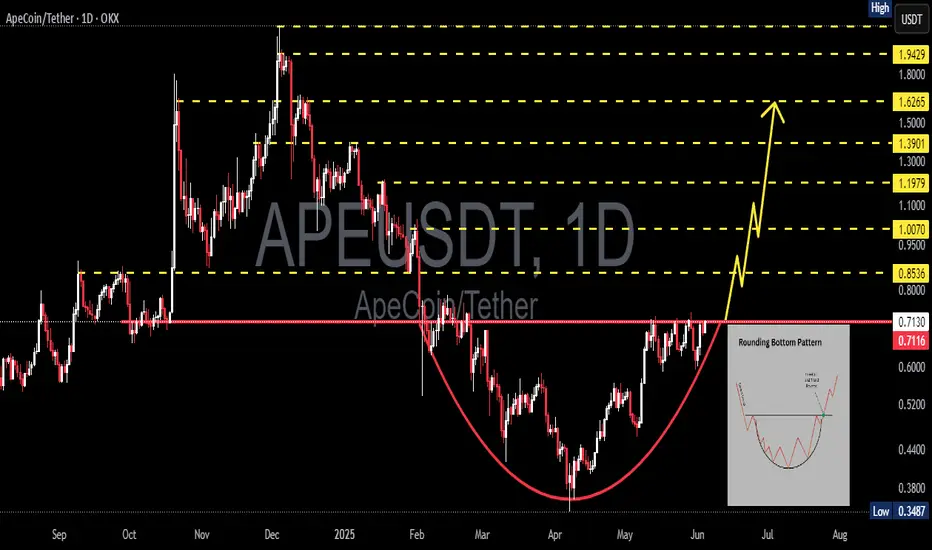
APEUSDT Poised for a Breakout! Cup & Handle Pattern Forming"Classic Pattern in a Bearish Market – A Big Move is Brewing!"
🧠 Technical Analysis Summary:
On the APE/USDT daily chart, we can clearly identify a Cup and Handle pattern, a classic bullish reversal structure that often signals the beginning of a significant rally. While many traders may be discouraged by the recent sideways movement, this formation indicates that smart money accumulation is happening quietly behind the scenes.
📌 Pattern Structure Breakdown:
🔴 The Cup:
Formed after a steep drop in late 2024, followed by a smooth rounded bottom that developed through May 2025.
The "U-shape" indicates a healthy recovery and accumulation phase, often seen before major trend reversals.
🟡 The Handle:
Currently forming a descending channel or bullish flag, representing a consolidation phase or "shakeout" before the next upward impulse.
This is typically the final dip before breakout in classic Cup & Handle formations.
📈 Key Resistance:
The yellow downward trendline is the neckline of the pattern.
A breakout above the $0.63–$0.65 zone will confirm the pattern and potentially spark a major move upward.
✅ Bullish Scenario (Upside Potential):
If a breakout is confirmed with strong volume and a daily candle closes above $0.65:
First target: $0.7452 (initial resistance)
Mid- to long-term bullish targets (measured from cup height):
🔹 $0.8658
🔹 $0.9934
🔹 $1.1931
🔹 $1.3804
🔹 $1.6171
🔹 $1.9585
🔹 $2.1669 → Main Cup & Handle Target
⏫ These targets are realistic if market sentiment turns bullish again and momentum builds.
⚠️ Bearish Scenario (Downside Risk):
If the breakout fails and price breaks down below the handle’s support zone:
Immediate support: $0.57 – $0.52
If $0.52 fails to hold:
🔻 $0.43
🔻 $0.3487 (Previous major low)
The pattern becomes invalid if the price breaks below the cup’s base at ~$0.43, suggesting bearish continuation.
📊 Additional Notes:
Volume is key. A valid breakout must be accompanied by a noticeable surge in trading volume.
Look for confirmation via RSI breakout or bullish divergence, and watch how price interacts with major moving averages.
Beware of false breakouts – a daily candle close above resistance with volume is the ideal confirmation.
💡 Final Thoughts:
APEUSDT is at a critical juncture. The nearly completed Cup and Handle pattern could be the launchpad for a major bullish rally. However, caution is advised—risk management and confirmation are essential for success in volatile crypto markets.
#APEUSDT #ApeCoin #CryptoBreakout #CupAndHandle #AltcoinAnalysis #TechnicalAnalysis #PriceAction #BullishCrypto #CryptoSetup #TradingSignal

APEUSDT 1D AnalysisAPE ~ 1D Analysis
#APE This trade is very risky
Buy after successfully breaking this resistance line with strong volume. With a short-term target of at least 15%+.
#APE/USDT#APE
The price is moving within a descending channel on the 1-hour frame, adhering well to it, and is heading for a strong breakout and retest.
We are seeing a bounce from the lower boundary of the descending channel, which is support at 0.5060.
We have a downtrend on the RSI indicator that is about to be broken and retested, supporting the upward trend.
We are looking for stability above the 100 moving average.
Entry price: 0.5386
First target: 0.5528
Second target: 0.5720
Third target: 0.5887

APE Main trend. Channel. Wedge. Reversal zones 05 05 2025Logarithm. Time frame 1 week.
1️⃣ Decline from the maximum by -98% , which is acceptable for assets of such liquidity and capitalization, after that either a trend reversal (main), or a complete scam.
2️⃣X (twitter) of this crypto project has 473 thousand subscribers . This army will be sent to pump this cryptocurrency at the right time in the so-called 3rd alt season of this cycle.
🟣And now work with a breakout of the descending wedge, and the price movement to the resistance of the descending channel. The percentage locally - medium-term showed for clarity from two zones - scenarios.
3️⃣The third plus is that this cryptocurrency is traded on 4 liquid exchanges: binance, bybit, okx, and most importantly Coinbase.
Line chart (trend direction and liquidity).

APEUSDT 1D AnalysisAPE ~ 1D Analysis
#APE successfully broke through this resistance line, expecting a 10%+ increase from here.

#APE/USDT#APE
The price is moving within a descending channel on the 1-hour frame, adhering well to it, and is heading for a strong breakout and retest.
We are seeing a bounce from the lower boundary of the descending channel, which is support at 0.4040.
We have a downtrend on the RSI indicator that is about to be broken and retested, supporting the upward trend.
We are looking for stability above the 100 moving average.
Entry price: 0.4122
First target: 0.4223
Second target: 0.4330
Third target: 0.4464

APE Analysis | Lost in the Jungle or Making a Comeback? (1D)The larger-degree APE pattern appears to be a large symmetrical triangle, and we are currently in the G wave of this pattern. The G wave is bearish, and within the G wave, we can also observe a smaller-degree symmetrical triangle.
It seems we are nearing the final leg of this pattern, and we expect one more drop from the red box. If the price reaches the green zone, we may have a low-risk opportunity to enter a buy position.
Potential targets are marked on the chart.
A daily candle closing below the invalidation level would invalidate this outlook.
For risk management, please don't forget stop loss and capital management
When we reach the first target, save some profit and then change the stop to entry
Comment if you have any questions
Thank You

#APE/USDT#APE
The price is moving in a descending channel on the 1-hour frame and is adhering to it well and is heading to break it strongly upwards and retest it
We have a bounce from the lower limit of the descending channel, this support is at a price of 0.4960
We have a downtrend on the RSI indicator that is about to be broken and retested, which supports the rise
We have a trend to stabilize above the moving average 100
Entry price 0.5770
First target 0.6096
Second target 0.6421
Third target 0.6856

APEUSDT 6DAPE ~ 6D Analysis
#APE Buy gradually from here if you still have a Conviction on this Coin. Short -term target of at least 20%+.

#APE/USDT#APE
The price is moving in a descending channel on the 1-hour frame and is adhering to it well and is heading to break it strongly upwards
We have a bounce from the lower limit of the descending channel, this support is at a price of 0.661
We have a downtrend on the RSI indicator that is about to be broken, which supports the rise
We have a trend to stabilize above the moving average 100
Entry price 0.661
First target 0.763
Second target 0.860
Third target 0.966

#APE/USDT Ready to go higher#APE
The price is moving in a descending channel on the 1-hour frame and sticking to it well
We have a bounce from the lower limit of the descending channel, this support is at 0.950
We have a downtrend on the RSI indicator that is about to be broken, which supports the rise
We have a trend to stabilize above the 100 moving average
Entry price 1.10
First target 1.28
Second target 1.52
Third target 1.73

#APE/USDT - Ready to go up#APE
The price is moving in a descending channel on the 30-minute frame and sticking to it well
We have a bounce from the lower limit of the descending channel, this support is at 1.06
We have a downtrend, the RSI indicator is about to break, which supports the rise
We have a trend to stabilize above the moving average 100
Entry price 1.10
First target 1.16
Second target 1.23
Third target 1.30

APE Will Reach $15 In 2025Hello, Skyrexians!
Today we analyze another one undervalued crypto which can bring 10X+ in 2025. We are talking about BINANCE:APEUSDT . Since it has been listed on major exchanges it is in global downtrend, but we assume now that this trend has beeb already finished.
Let's take a look at the weekly time frame. We can notice the clear Elliott 5 Waves structure. The last one was finished with the green dot at the bottom on the Bullish/Bearish Reversal Bar Indicator . As always, alerts from this indicator are automatically replicated on my accounts. You can find the information in our article on TradingView .
This reversal will bring the price very high but we don't expect the new ATH, the 0.61 Fibonacci retracement is enough for bull run, therefore $15 is the our target in 2025.
Best regards,
Skyrexio Team
___________________________________________________________
Please, boost this article and subscribe our page if you like analysis!

Can #APE Bulls Defend this Key Level or Not? Bears in ControlYello, Paradisers! Are we on the verge of a massive breakdown for #APEUSDT, or will the bulls reclaim control and surprise everyone? Let’s break down the #ApeCoin setup:
💎#APE has been under pressure since hitting a local top near the $2.00 region. Strong selling pressure has taken over, driving the price lower and putting the ascending support line, which has held since October, into question. This trendline is now critical for bulls, as a breakdown below could trigger a significant shift in market sentiment.
💎The immediate support level at $1.09 is acting as a psychological and technical barrier. However, if this level fails to hold, the price could drop rapidly toward the strong support zone around $0.68. This area aligns with historical demand levels and could attract buyers looking for value, but failure to find support here would expose #APEUSD to even lower levels, with $0.477 emerging as the next likely target.
💎On the bullish side, reclaiming the $1.40 resistance zone is essential to invalidate the bearish outlook. A daily close above this level would signal that bulls are regaining strength, potentially paving the way for a rally toward $1.80 and beyond. Until then, however, the bias remains bearish and bears seem in control.
Stay focused, patient, and disciplined, Paradisers🥂
MyCryptoParadise
iFeel the success🌴

APE planThis is my plan for APE. I will add more if the market gives me orange box. Which I think we will get.

APE Super-Pump📉💤 Current Price Dip: APE is trending near the lower support zone.
💎🛒 Buy Zone: Strong accumulation area highlighted for potential entries.
🚀💵 Profit Target: High breakout potential towards 1100% gain!
⚠️📊 Risk Alert: Monitor for volatility near support levels.
Buy Zone (🛒): Highlight the area near 1.15 to 1.35 as the "Buy Zone" with a green rectangle or label.
Take Profit Zones (💰): Mark key levels like 2.5, 3.3, 6.4, and 15.5 as profit-taking zones with horizontal lines and dollar signs.
Stop Loss (⛔): Add a red line near 0.85 for the stop-loss level to indicate a potential exit in case of further dips.
Breakout Alert (🚀): Add a rocket symbol near 3.3 to signal a key breakout level for significant upward momentum.
Target Zone (🎯): Shade the area from 6.4 to 15.5 to indicate the long-term profit zone.

Ape out of the woods yet? not the time to ape in yet. Apecoinit seems to have finally broken out, though not very convincingly on a weekly timeframe from its down only move. It may have a pathway to an uptrend, but will need to watch next week to confirm this is not just a fakeout

Apecoin chart per request.I’m not entirely sure how this chart will play out, currently looks like this chart’s price action is heading towards this brown trendline that will either serve as a double bottom neckline or if it holds resistance for a candle or few t will become the top trendline of a valid descending channel at that point, either way the target would be the same for a breakout from either pattern, won’t be able to dial in the exact placement of the dotted goldenrod colored measured move line until price chooses where it’s going to trigger the breakout but I believe I have arbitrarily placed it in a close enough radius to get a within the ballpark of a decent price target guesstimation. Once again we see a big bullish pump coinciding with the golden cross as well. *not financial advice*

APEUSDT - Huge Potential LongI love this setup here for a long entry. Massive volume is coming into APE, which with the launch of Apechain has a huge amount of potential. If you haven't checked out their site www.apechain.com you will see what I'm talking about.

Time to APE into $APE?Ape is looking extremely bullish here. You can see price has been consolidating in a downtrend since 2022.
Now price looks set to break upwards.
On Oct 22, we saw a strong move with high volume into the trend line. The next move up into the trend line should break the downtrend and move towards one of the resistance levels above.
I entered at $1.09.

APE will be bullish againThe APE correction seems to have been a diamond diametric as we are now at the end of the G wave.
This correction was wave B. Expect a C wave for APE.
Wave C will be bullish.
Closing a daily candle below the invalidation level will violate this analysis.
For risk management, please don't forget stop loss and capital management
Comment if you have any questions
Thank You
