#APE (SPOT- Investing ) entry (0.60 - 0.830). SL (0.475)entry range ( 0.60 - 0.830)
SL .Daily close below (0.475)
**NOTES***
1* this coin is very heavy, it may take long time to achieve the targets and the targets is for the BULL RUN
2* collect the coin slowly in the entry range ( do not all in one time in one price )
***********************************************************
BINANCE:APEUSDT
#APE
#APEUSDT
#APEUSD
#swingtrade
#shortterminvestment
#ALTCOIN
#Cryptotading
#cryptoinvesting
#investment
##trading
#cryptocurrencytrading
#bitcoininvestments
#Investing_Coins
#Investingcoins
#Crypto_investing
#Cryptoinvesting
**** #Manta ,#OMNI, #DYM, #AI, #IO, #XAI , #ACE #NFP #RAD #WLD #ORDI #BLUR #SUI #Voxel #AEVO #VITE #APE ****
#bitcoin
#BTC
#BTCUSDT
APEUSD

APE, REVERSING to the upside -- HUGE RR!APE as of this posting is currently registering huge net buy volumes -- conveying longers to be positioning in anticipation of the breakout season of the market.
APE is sitting at major order block support at 3.0 levels -- the strength of this level is unquestioned.
The price range is at a very discounted level FIB wise. Best level to seed.
Spotted at 3.30
TAYOR
Safeguard capital always.

#APE/USDT#APE
The price is moving in a downward channel on the 12-hour frame upwards and is expected to continue
We have a trend to stabilize above the moving average 100 again
We have a downward trend on the RSI indicator that supports the rise by breaking it upwards
We have a support area at the lower limit of the channel at a price of 1.00
Entry price 1.095
First target 1.34
Second target 1.52
Third target 1.70

ApeCoin APE price gave a ray of hope, for the first time in 2.5yWhat happened in #ApeCoin that the price gained +160% in 3 days?)
In principle, OKX:APEUSDT still has the potential to rise to $2, and then "they" can draw an inverted head and shoulders. Although, it's a bit scary to "get long" before $0.85.
At the #SUIUSDT chart has clearly worked out this pattern.
Another concern is how thin the crypto market is: a little effort and you can pump the asset so much that #APE which has been in a stable downward trend for more than 2.5 years, “jumped” to 4th place in terms of trading volume, right after CRYPTOCAP:BTC , CRYPTOCAP:ETH and CRYPTOCAP:SOL
_____________________
Did you like our analysis? Leave a comment, like, and follow to get more

APEUSDT - 1h Has to correct part of the riseAPEUSDT - 1h Has to correct part of the rise
If you like my AT, and you agree with the approaches, please FOLLOW ME and press BOOST so we can share it with more people. We are working on an automated trading tool so that everyone can apply their strategies in a VISUAL and PROFESSIONAL way, as we present in the analysis.
Thank you!
_______________________________________________________
APEUSDT - 1h Has to correct part of the rise
I'll be brief, it won't be easy, it won't be linear, but it seems that APE has reached its maximum at 1.70.
Correction target : 1.24 - 1.12
The waves won't be easy to ride but there is a strategy and important goals to achieve if things are done right.
_______________________________________________________
Automated Cryptocurrency Trading Bots: All these strategic alternatives can be configured with TradeX BoT, since it will allow you to position in both directions without having to block any amount per position. It will only be necessary for the conditions to be met, either downward or upward, for the orders to be executed in one direction or another, taking the necessary deposits from your portfolio.
TradeX BoT (in development): Tool to automate trading strategies designed in TradingView. It works with both indicators and technical drawing tools: parallel channels, trend lines, supports, resistances... It allows you to easily establish SL (%), TP (%), SL Trailing... multiple strategies in different values, simultaneous BUY-SELL orders, conditional orders.
This tool is in the process of development and the BETA will soon be ready for testing.
FOLLOW ME and I will keep you informed of the progress we make.
I share with you my technical analysis assessments on certain stocks that I follow as part of the strategies I design for my portfolio, but I do not recommend anyone to operate based on these indicators. Inform yourself, train yourself and build your own strategies when investing. I only hope that my comments help you on your own path :)

Why Support and Resistance Points Are Important
Hello, traders.
If you "Follow", you can always get new information quickly.
Please click "Boost".
Have a nice day today.
-------------------------------------
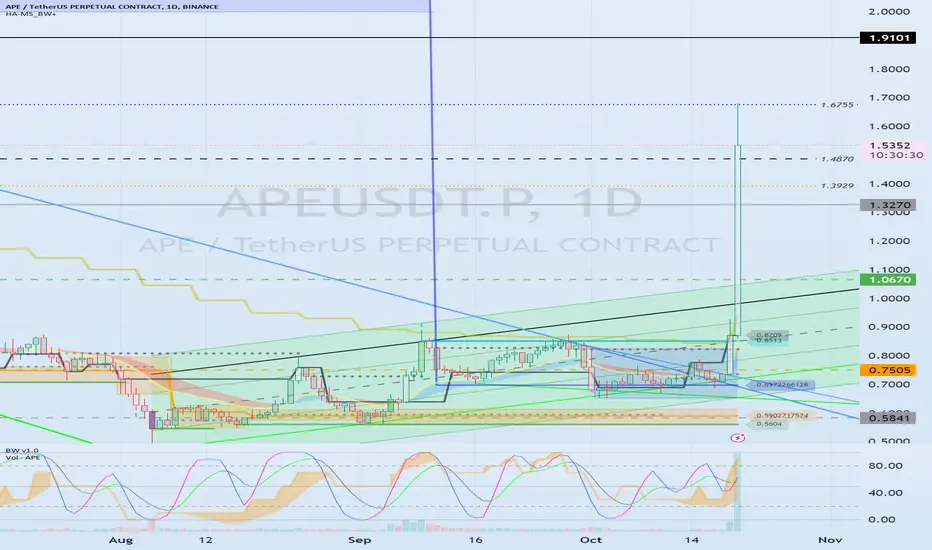
(APEUSDT.P 1M chart)
Usually, the arrangement of candles is used to indicate support and resistance points.
Basically, indicators are used to indicate support and resistance points.
However, I feel like support and resistance points are needed in the 1.9101-6.7780 range.
So, there is a possibility that support and resistance points are drawn near where the fingers are pointing.
The price is currently under 1.9101, so let's check it out on another time frame chart.
In any case, the point to watch is whether it can rise after receiving support in the 1.3270-1.9101 section.
-
(1W chart)
When drawing support and resistance points using indicators, it is best to draw indicators that are currently marked with candles.
This is because it means that the current point is acting as support and resistance.
Other than that, you can mark indicators that are thought to have a longer horizontal line than other horizontal lines.
If you check the chart above, I think you'll understand what I mean.
Since the important support and resistance points are indicators that are currently marked with candles, you can create a trading strategy targeting the corresponding horizontal lines.
The sections marked as Support and Resistance on the chart correspond to those.
You can think of the remaining lines as lines that can be used for detailed strategies that allow you to conduct split transactions when conducting transactions.
In that sense, the 1.4870 point can be used for detailed trading strategies, that is, response strategies.
Accordingly, you can proceed with buying or selling.
-
(1D chart)
The support and resistance points to be used for detailed trading strategies are indicated in the 1.320-1.9101 section.
That is, the points 1.3929 and 1.6755 are applicable.
These two points correspond to the HA-Low and HA-High indicator points.
-------------------------------------------------
If you have indicated support and resistance points on the 1M, 1W, and 1D charts as above, you can mark them according to the importance of the support and resistance points and create chart analysis or trading strategies for them.
Important support and resistance points are
1st: 0.5841-0.7505
2nd: 1.0670
3rd: 1.3270
4th: 1.9101-2.1090
You can use the points or sections above to create chart analysis or trading strategies.
When marking support and resistance points, do not draw them while thinking about chart analysis or trading strategies.
The reason is that if you do so, you will likely mark support and resistance points while reflecting your subjective thoughts and psychology.
Therefore, when marking support and resistance points, it is important to focus only on the arrangement of candles without thinking about anything else.
-
Have a good time.
Thank you.
--------------------------------------------------
- Big picture
It is expected that a full-scale uptrend will begin when it rises above 29K.
The section expected to touch the next bull market is 81K-95K.
#BTCUSD 12M
1st: 44234.54
2nd: 61383.23
3rd: 89126.41
101875.70-106275.10 (overshooting)
4th: 134018.28
151166.97-157451.83 (overshooting)
5th: 178910.15
These are points where resistance is likely to occur in the future.
We need to check if these points can be broken upward.
We need to check the movement when this section is touched because I think a new trend can be created in the overshooting section.
#BTCUSD 1M
If the major uptrend continues until 2025, it is expected to start forming a pull back pattern after rising to around 57014.33.
1st: 43833.05
2nd: 32992.55
-----------------
APE COIN PRICE ANALYSIS AND POSSIBLE TRADE SETUP !!GETTEX:APE Coin Update !!
In last 3 days price almost surge around 100%+ & currently look in overbought zone 🚨
Small dip expected from its liquidation zone or from its feb key levels ✅
But without SL Don't Build any trade on it ... Manipulation is too high 🚨
Also Don't Use High Fund or High Leverage ✅
Without confirmation on Lower tf's 1h, 30m & 15m don't build any side trade on it 🚨

Will #APE See a Breakout or Keep Falling? Key Levels to WatchYello, Paradisers! Are you ready for the next big move in the #Apecoin? Let’s dive into #APEUSDT analysis, where things are getting intense:
💎#APE is currently showing signs of a potential bullish continuation from a crucial Bullish Order Block (OB) at $0.563. We’ve been watching #ApeCoin navigate a descending channel.
💎Recently, it’s been making a serious attempt to break above this formation, gaining momentum from that Bullish OB. If this upward push holds, we could be in for a powerful bullish surge.
💎But here's the catch— GETTEX:APE needs to break through the key resistance level at $0.788 to confirm this bullish scenario. Should this happen, we could witness a significant rally, with the first target pegged at the Bearish OB around $1.03. This is where things could get really exciting.
💎However, let's not get ahead of ourselves. If the momentum fizzles out near this demand zone, we could see a pullback to the lower demand area at $0.473. A daily close below this support zone would flip the script, invalidating our bullish outlook and potentially leading to further declines.
Stay disciplined, patient, and ready to adapt to whatever the market throws our way.
MyCryptoParadise
iFeel the success🌴

APEUSDTAPE ~ 1D ✅
#APE Need to wait until this descending pattern is successfully broken to start buying.

#APE/USDT#APE
Our price is moving downwards on a 1-hour frame and is about to break it upward in stages
We have a bounce from the lower border of the channel from the support area in green at 0.66
We have a tendency to stabilize above the Moving Average 100
Entry price is 0.690
The first goal is 0.778
The second goal is 0.827
Third goal 0875

APE/USDT Investment UpdateHello everyone. Bitcoin went against the majority, including myself, and didn't drop to 40-50k as I anticipated.
➖ I had to correct my mistake and bought APE/USDT with 100% of my portfolio.
➖ Based on the orders, the first target is $1.80-$1.90.
➖ The second target is closer to $5, and the long-term target could be $25-$50 considering the launch of the Otherside game. As we approach $1.80-$1.90, I will likely close half of the position and diversify my portfolio with other cryptocurrencies.
#ape #Apecoin #bitcoin #otherside

APE: Channel Down BreakoutTrade setup : Price broke out of Channel Down pattern, which could signal a bullish trend reversal with +15% upside potential to $1.50. Stop Loss (SL) level at $1.09 (below prior swing low). This is a riskier trade setup because it’s a trend reversal not a trend continuation setup. It’s against the overall downtrend.
Pattern : Price was trading in a Channel Down pattern. With complete patterns (i.e. a breakout) – initiate a trade when the price breaks through the channel’s trendlines, either on the upper or lower side. When this happens, the price can move rapidly in the direction of that breakout. Learn to trade chart patterns in Lesson 8.
Trend : Neutral on Short-Term basis and Downtrend on Medium- and Long-Term basis.
Momentum is Mixed as MACD Line is above MACD Signal Line (Bullish) but RSI ~ 50 (Neutral).
Support and Resistance : Nearest Support Zone is $1.25, then $1.00. The nearest Resistance Zone is $1.55 (previous support), then $1.85.

#APE/USDT Trading at the Bottom. 2500% to reach the ATH!Welcome to this quick trade setup, everyone.
First of all, I request you to follow me if you want to leverage the upcoming altcoin season of 2024. I will be dropping the best 30 trade setups for this bull run. In 2021, I posted 28 altcoins, 18 of which achieved 10x to 30x returns, 5 did 5x to 8x, while a few didn't have a significant run. You can check my previous charts for the results.
I will be doing that again, so stay with me.
Let's get straight to this chart. APE is trading right around the bottom as we speak. The all-time low for APE is $1, and it is currently 24% up from there.
Is it a good investment? APE hasn't had a significant run yet. To achieve the previous ATH, it needs to pump almost 2500%+. Is it a good bet? Considering the technical analysis, yes.
I am adding a small bag here and will DCA all the way to $0.80. The target is $15 to $27.
But always DYOR, this is not financial advice.
If you want more trade setups, please hit the like button to support my content.
Thank you.
#PEACE

APE UTAD to $2.50Ape is approaching the top of this range again - it still hasn't quite reached the 1.618 from waves 1 + 3. As most Elliott Wave enthusiasts will tell you, you can normally find the wave 5 target by pulling fib extensions on wave 1+3. This has been the case for many of the other alts as well, as they all approach major macro wave 5 targets. Look for APE to take out the current highs into that 1.618 to form the UTAD here

APE: stop buy📊Analysis by AhmadArz:
🔍Entry: 1.315
🛑Stop Loss: 1.257
🎯Take Profit: 1.345 -1.419 -1.536
🔗"Uncover new opportunities in the world of cryptocurrencies with AhmadArz.
💡Join us on TradingView and expand your investment knowledge with our five years of experience in financial markets."
🚀Please boost and💬 comment to share your thoughts with us!

APEUSD 1WAPE ~ 1W 📈
#APE Will touch the lowest support. We thought we would place a small buy here with a target of at least 20%+

#APE/USDT#APE
The price is moving in a bearish channel on a 4-hour frame and is adhering to it well. The price has rebounded from the green zone and is expected to retest it at the price of $1.0
We have a tendency to stabilize above the Moving Average 100
We have an uptrend on the RSI indicator to support the rise
Entry price is 1.00
The first goal is 1.32
The second goal is 1.50
The third goal is 1.75

#APE/USDT#APE
The price is moving in a downward channel on a 4-hour frame, about to break upward
The area in green is a very strong support area and the price rebounded from it at the price of 1.75
We have an upward trend on the RSI indicator
We have a higher stability moving average of 100
Entry price 2
First goal 2.12
Second goal 2.29
Third goal 2.47

APE ANALYSIS (1D)APE appears to be forming a large triangle.
Now it seems that the big wave C is over and we are in the waves of wave D.
From the green range, I expect a trend change for APE.
The targets are clear on the chart.
Closing a daily candle below the invalidation level will violate the analysis
For risk management, please don't forget stop loss and capital management
When we reach the first target, save some profit and then change the stop to entry
Comment if you have any questions
Thank You

#APE/USDT#APE
The price has been moving in a down channel since July 2022
The price adhered to the boundaries of that channel perfectly
Now we have an upward trend on two levels
Current price 1.70
First goal 3.44
Second goal 5.14

Apecoin UPTREND coming soon..Apecoin have been in a downtrend 7 months now. You can see clearly BULLISH signs. 1. Bullish divergence (which indicate bears are getting tired and weaker which indicate reversal coming), 2. On-chain data shows that WHALES are BUYING HEAVYILY since June/july/august. 3. Apecoin already 95% down from ATH (most altcoins pump when they reach 95/96%).
it's time for UPTREND after 7 months of downtrend..
BUT, PAY ATTENTION: be PREPARED that apecoin may still go lower even to 1 dollar. but i will ADD UP to my long position. the probability of UPTREND are MUGH HIGHER now than further downtrend.
BINANCE:APEUSDT KUCOIN:APEUSDT COINBASE:APEUSD BITSTAMP:APEUSD COINBASE:APEUSDT KRAKEN:APEUSDT

APE COIN - Cup & handleThis is a bull market coin obviously
We are still crypto summer --- but silly season is coming
APE will obvioulsy draw a crowd again
It's a fairly large cap now we don't how silly it will get ..
treat it as a tradable asset

APE - BUY SETUP (NOV 2023)APE - BUY SETUP.
Based on technical analysis, the current setup of this coin appears to offer a favorable buying opportunity. Key indicators signal promising trends, suggesting a potential advantageous entry point. However, prudent consideration of market volatility and risk management is essential before making any investment decisions in the cryptocurrency market.
