APE: Triple Bottom?As we can see, since July 2022, the support zone around $4.25 - $4.65 seems to be a strong area of demand. If the markets start to rally soon, we should see APE retesting resistances of $6 and $7.70 in the coming weeks.
APEUSD

APEUSD: 65% correction warning distribution(SL/TP)(NEW)Why get subbed to me on Tradingview?
-TOP author on TradingView
-2000+ ideas published
-15+ years experience in markets
-Professional chart break downs
-Supply/Demand Zones
-TD9 counts / combo review
-Key S/R levels
-No junk on my charts
-Frequent updates
-Covering FX/crypto/US stocks
-before/after analysis
-24/7 uptime so constant updates
🎁Please hit the like button and
🎁Leave a comment to support our team!
APEUSD: 65% correction warning distribution(SL/TP)(NEW)
IMPORTANT NOTE: speculative setup. do your own
due dill. use STOP LOSS. don't overleverage.
🔸 Summary and potential trade setup
::: APEUSD daily chart review
::: updated/revised outlook
::: distribution in range / weak chart
::: limited upside / expect dump from HIGHS
::: weakness will last for 4-8 weeks
::: LOG SCALE chart
::: not a great looking chart
::: SYMM Triangle setup / BEARS
::: aggressive FED rate hikes guaranteed now
::: CLEAN REJECTION AT recent highs
::: S/R was re-tested produced WEAK bounces
::: final BOUNCE possible now before DUMP
::: also noteworthy sequence of lower highs
::: recommended strat: SHORT from range highs
::: final TP BEARS is 2.00/2.20 usd
::: 60-65% correction possible next
::: 4-8 weeks in October/Noveber 2022
::: right now no upside in this market
::: position traders should wait for
::: better entry prices later after
::: final PUMP possible into FED to trap BULLS
::: recommended strategy: SHORT SELL RIPS/ RALLIES
::: TP BEARS is +65% gains - near 2.00 USD
::: BULLS stay out until correction is over
::: SWING TRADE: SHORT/HOLD IT
::: correction run not over yet
::: good luck traders!
::: BUY and get paid. period.
🔸 Supply/Demand Zones
::: N/A
::: N/A
🔸 Other noteworthy technicals/fundies
::: TD9 /Combo update: N/A
::: Sentiment mid-term: BEARS/CORRECTION/65%
::: Sentiment short-term: BULLS/FAKE FINAL PUMP
RISK DISCLAIMER:
Trading Crypto, Futures , Forex, CFDs and Stocks involves a risk of loss.
Please consider carefully if such trading is appropriate for you.
Past performance is not indicative of future results.
Always limit your leverage and use tight stop loss.

APEUSD ❕ under the upper boundary of zoneTrading volumes are low.
Price is overbought on several indicators (1H TF)
APE tests 200MA as resistance (1H TF)
Price and RSI have formed a bearish divergence (30m TF)
I expect a drop when it fixes under the zone boundary.
APE Scalping in 1Hits simple long in green , short in Red
Red Area is resistance
Green Area is Support

APE - 4H bearishThe APE price crossed the uptrend line and has enough bearish momentum to break out of the support zone.
You can scalp on the lower time frames as well.

Ape, bananas or nap?There are a couple contributing factors that would lead to further down in APE, Algos and an Elliott Wave Pattern for continuation of the initial move. So watching for a swift move down and a break of the ZZ pivot. If you have found this inspiring/helpful please consider a boost and follow! Also check out the links in my signature to get to know me better! Cheers!

APEUSDT - TRADE PLANCheck out the trade plan for APE today based on the technical analysis. Hope this analysis is useful, make sure to hit the thumbs and also follow my tradingview profile for future updates. Thank you!
👉🏻Keeping an eye on the short-term waves formed on this pair.
👉🏻Connected the higher lows formed to identify the trend line and find if the price respects the trend line one more time with a bullish reversal.
👉🏻Highlighted an important key level in play closer to the current market price if this level will support the price for a reversal expected.

APEUSD ❕ upward channelAPE is in an upward channel above liquidity.
Trading volumes show no interest in falling prices.
TD Sequential has formed an up reversal signal (1H TF)
I believe that APE can continue to grow with fixing above the lower boundary of the channel.

APEUSD ❕ above the liquidity zoneAPE is successfully working a bearish divergence (4H TF)
The asset is moving above the liquidity zone.
Price has consolidated above the 200MA and 100MA (4H TF)
I believe that APE can continue to rise with successful hold on support.

APEUSD (APE) - Broken through key resistance 📉APEUSD has broken through key resistance and is prepped to drop towards the take profit levels shown.

ApeCoin APE bearish sentimentNext week we have the FOMC meeting.
Most likely the Federal Reserve will raise rates by 75 basis points. In case of 100 basis points increase, i expect a sell-off in the markets.
Major cryptocurrencies have seen heavy coin inflow into exchanges recently.
I expect a strong sell pressure next week.
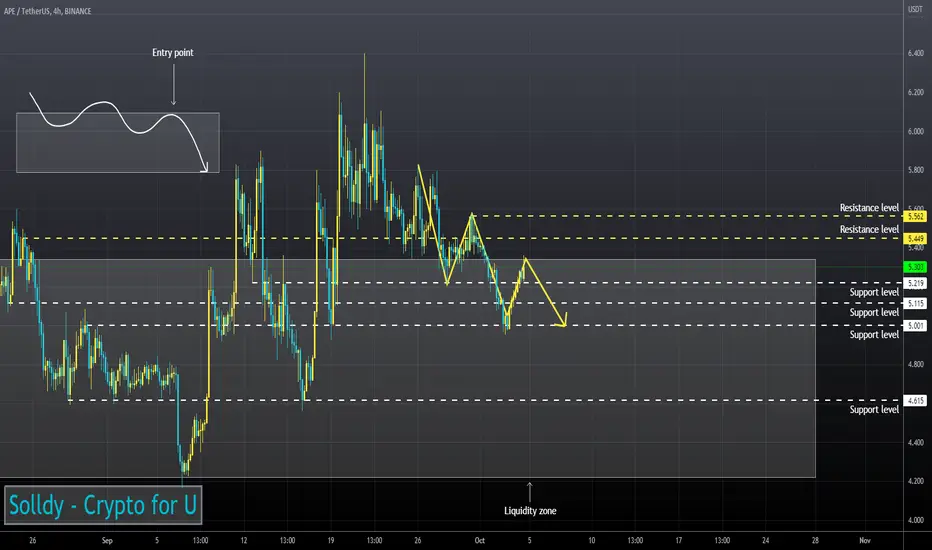
APE/USDT short
Entry Range: $5.30 - 5.65
Price Target 1: $4.58
Price Target 2: $4.19
Price Target 3: $3.20
Stop Loss: $6.15

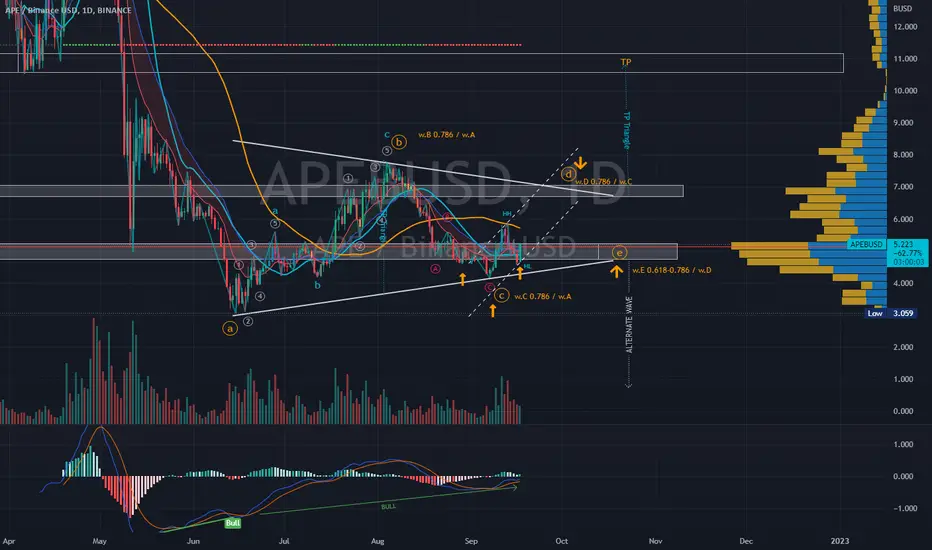
APEUSD | Wave Analysis | Bullish Triangle ABCDE ProjectionPrice action and chart pattern trading setup
> A possible upcoming bullish triangle ABCDE wave within 1-2 months
> B-wave retraced 0.786 of A-wave and recent C-wave retraced exactly 0.786 of B-wave.
> Expecting uptrend D-wave at 0.786 of C-wave with an inverted head n shoulders reversal pattern.
> Entry: head n shoulders breakout
> Target: D-wave position +30%+
> Stoploss: right shoulder -10%
> RRR: 3:1
Indicator:
> MACD above signal line just below 0.
> RSI bullish momentum rebounded from MA line
Nothing is 100%, always trade with affordable risk and respect your stoploss
APEUSD ❕ above the liquidityAPE looks stronger than many coins.
Trading volumes show no interest in a drop in price.
The token is still above liquidity.
I think the asset could bounce if the price consolidates above the range.

APEUSDT 12h Correction ends, soon a strong Apecoin movement upMore than a month ago we published the idea of a APEUSDT trade pair
Then we warned that you must be careful with the longings, as a deep correction could begin.
So it happened, the APEUSD price reached the liquidity zone $4.25-5.25
Now the APE price is a second retesting above the above-mentioned liquidity zone, which gives good conditions for a set of medium and long -term position:
Entrance in the range of $4.72-5
Stop below $4.1698
Take Profit $13.44
Profit/loss ratio 12.5/1
_______________________________
Since 2016 , we have been analyzing and trading the cryptocurrency market.
We transform our knowledge, trading moods and experience into ideas. Each "like under the idea" boosts the level of our happiness by 0.05%. If we help you to be calmer and richer — help us to be happier :)

Keep an eye on APE - could make a move soon!Here's a quick Look at APE 30 min chart.
The best entry would be when the price breaks above 5.51$ with a good amount of volume. One to keep an eye on.
-------------------------------------------
The idea is: Buy when the price breaks above 5.51$ and take profits at the levels shown in the chart.
Targets:
1. 5.57$
2. 5.7$
3. 5.8$
4. 6.2$
-------------------------------------------
What are triangles when it comes to trading?
Key points:
"1. In technical analysis , a triangle is a continuation pattern on a chart that forms a triangle-like shape.
2. Triangles are similar to wedges and pennants and can be either a continuation pattern if validated or a powerful reversal pattern, in the event of failure.
3. three potential triangle variations can develop as price action carves out a holding pattern, namely ascending, descending, and symmetrical triangles."
-------------------------------------------
If you like the content, then make sure to comment and like the post :D
Follow me for daily profitable trading setups
BTC dictates the market. If BTC falls, then Alts will fall as well. Trade safe!


APEUSD ❕ downtrend in rangeAPE is moving in the liquidity zone near the upper boundary.
Price in the overbought zone (4H TF)
I believe that APE can go down, provided the price consolidates under the support level.

💡Don't miss the great buy opportunity in APEUSD @apecoinTrading suggestion:
". There is a possibility of temporary retracement to the suggested support line (4.850).
. if so, traders can set orders based on Price Action and expect to reach short-term targets."
Technical analysis:
. APEUSD is in a range bound, and the beginning of an uptrend is expected.
. The price is above the 21-Day WEMA, which acts as a dynamic support.
. The RSI is at 76.
Take Profits:
TP1= @ 5.504
TP2= @ 5.965
TP3= @ 6.566
TP4= @ 7.158
TP5= @ 7.718
SL= Break below S2
❤️ If you find this helpful and want more FREE forecasts in TradingView
. . . . . Please show your support back,
. . . . . . . . Hit the 👍 LIKE button,
. . . . . . . . . . Drop some feedback below in the comment!
❤️ Your support is very much 🙏 appreciated!❤️
💎 Want us to help you become a better Forex / Crypto trader?
Now, It's your turn!
Be sure to leave a comment; let us know how you see this opportunity and forecast.
Trade well, ❤️
ForecastCity English Support Team ❤️

💡Don't miss the great buy opportunity in APEUSD @apecoinTrading suggestion:
". There is a possibility of temporary retracement to the suggested support line (4.850).
. if so, traders can set orders based on Price Action and expect to reach short-term targets."
Technical analysis:
. APEUSD is in a range bound, and the beginning of an uptrend is expected.
. The price is above the 21-Day WEMA, which acts as a dynamic support.
. The RSI is at 76.
Take Profits:
TP1= @ 5.504
TP2= @ 5.965
TP3= @ 6.566
TP4= @ 7.158
TP5= @ 7.718
SL= Break below S2
❤️ If you find this helpful and want more FREE forecasts in TradingView
. . . . . Please show your support back,
. . . . . . . . Hit the 👍 LIKE button,
. . . . . . . . . . Drop some feedback below in the comment!
❤️ Your support is very much 🙏 appreciated! ❤️
💎 Want us to help you become a better Forex / Crypto trader ?
Now, It's your turn !
Be sure to leave a comment; let us know how you see this opportunity and forecast.
Trade well, ❤️
ForecastCity English Support Team ❤️

APE: Bullish Divergence + Wedge PatternOn the daily timeframe, APE is forming a descending wedge pattern with bullish divergence on the RSI. The RSI is also showing that it's oversold.
I expect a bounce up from the local support levels. If support fails, then $3 is the last line of defense before making any lower lows.
Strong resistance around $5.50

APECOIN APE: Bad Days Ahead!Hello friends, today you can review the technical analysis idea on a 1D linear scale chart for Apecoin (APEUSD).
The chart is self-explanatory. With the crypto market going through a correction, Apecoin may still have downside to go. See where I believe there may be strong support and possible bottom.
Included in the chart: Trend line, Support and Resistance Lines, Volume Profile (VPVR), Ichimoku Cloud, RSI, MFI and Volume.
If you enjoy my ideas, feel free to like it and drop in a comment. I love reading your comments below. More ideas below!
Disclosure: This is just my opinion and not any type of financial advice. I enjoy charting and discussing technical analysis. Don't trade based on my advice. Do your own research! #cryptopickk

TRADE ALERT - Long Ape to 8.10Traders,
This next trade has the potential of 86%+ profit. I have waited very patiently for APE to come down to it’s strong support of $4.29 …and here it is. I believe it’s go time!
Position = APE
Entry = 4.34
Stop Loss = 2.88
Final Target = 8.10
Risk/Reward = 2.5/1
Leverage = 1x
Profit Potential = +86%
Best of luck!
Stew

ApeCoin APE bearish sentimentSeptember has major catalysts for the crypto market as well as for the stock market.
The Ethereum merge on September 6th, that will end on Sept 20, the inflation report on September 13 and the next FOMC meeting afterwards with the new interest rates hike.
That is reflected in the crypto space in general as a bearish outlook.
ApeCoin APE is a cypto with a negative overall sentiment recently.
I have the following price targets:
APE/USDT short
Entry Range: $4.70 - 5.10
Price Target 1: $4.20
Price Target 2: $3.50
Price Target 3: $3.10
Stop Loss: $5.90
