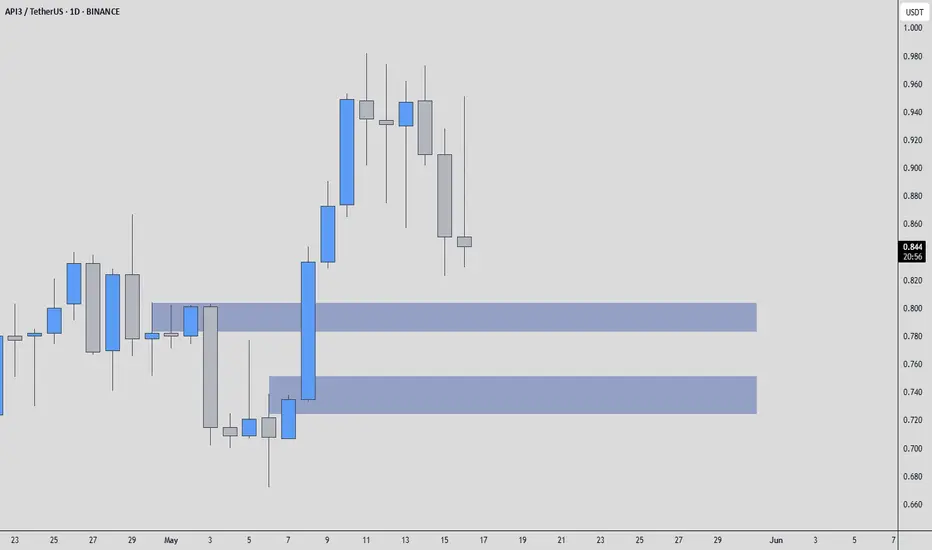
API3USDT - Looks Good!When most traders are looking at flashy pumps, I’m watching structure, confirmation, and where real buyers are hiding. In this case, the blue boxes are not just drawn for aesthetics, they represent potential accumulation zones, places where price might find its footing if approached with the right momentum and volume context.
We’ve seen this behavior before: strong drops into support, followed by subtle CDV divergence, an uptick in volume, and then a quick reclaim. That’s the kind of move that gives traders an edge, if they’re patient enough to wait for it.
But let’s be real, trading without confirmation is gambling. I say this every time: I will never insist on my long idea if the levels don’t react. If there’s no reclaim or strength in the low timeframe, I step back.
Volume, CDV, and reaction around these levels are everything. The market has been unforgiving lately, and API3 is no exception. However, these blue box zones still carry potential, if buyers show up.
📌 Stay sharp, stay flexible. This is how the highest win-rate traders operate, not by chasing, but by setting traps and waiting for price to walk in.
📌I keep my charts clean and simple because I believe clarity leads to better decisions.
📌My approach is built on years of experience and a solid track record. I don’t claim to know it all but I’m confident in my ability to spot high-probability setups.
📌If you would like to learn how to use the heatmap, cumulative volume delta and volume footprint techniques that I use below to determine very accurate demand regions, you can send me a private message. I help anyone who wants it completely free of charge.
🔑I have a long list of my proven technique below:
🎯 ZENUSDT.P: Patience & Profitability | %230 Reaction from the Sniper Entry
🐶 DOGEUSDT.P: Next Move
🎨 RENDERUSDT.P: Opportunity of the Month
💎 ETHUSDT.P: Where to Retrace
🟢 BNBUSDT.P: Potential Surge
📊 BTC Dominance: Reaction Zone
🌊 WAVESUSDT.P: Demand Zone Potential
🟣 UNIUSDT.P: Long-Term Trade
🔵 XRPUSDT.P: Entry Zones
🔗 LINKUSDT.P: Follow The River
📈 BTCUSDT.P: Two Key Demand Zones
🟩 POLUSDT: Bullish Momentum
🌟 PENDLEUSDT.P: Where Opportunity Meets Precision
🔥 BTCUSDT.P: Liquidation of Highly Leveraged Longs
🌊 SOLUSDT.P: SOL's Dip - Your Opportunity
🐸 1000PEPEUSDT.P: Prime Bounce Zone Unlocked
🚀 ETHUSDT.P: Set to Explode - Don't Miss This Game Changer
🤖 IQUSDT: Smart Plan
⚡️ PONDUSDT: A Trade Not Taken Is Better Than a Losing One
💼 STMXUSDT: 2 Buying Areas
🐢 TURBOUSDT: Buy Zones and Buyer Presence
🌍 ICPUSDT.P: Massive Upside Potential | Check the Trade Update For Seeing Results
🟠 IDEXUSDT: Spot Buy Area | %26 Profit if You Trade with MSB
📌 USUALUSDT: Buyers Are Active + %70 Profit in Total
🌟 FORTHUSDT: Sniper Entry +%26 Reaction
🐳 QKCUSDT: Sniper Entry +%57 Reaction
📊 BTC.D: Retest of Key Area Highly Likely
📊 XNOUSDT %80 Reaction with a Simple Blue Box!
📊 BELUSDT Amazing %120 Reaction!
📊 Simple Red Box, Extraordinary Results
I stopped adding to the list because it's kinda tiring to add 5-10 charts in every move but you can check my profile and see that it goes on..
API3BTC
API3 looks bearish (2H)API3 has not issued a bearish trigger yet, but considering that it has hit a key resistance level, formed a base, and the base has been broken, it is expected that the price will be rejected downward during the pullback.
We anticipate a drop from the red zone downward.
Targets are marked on the chart.
A 4-hour candle closing above the Invalidation Level will invalidate this analysis.
For risk management, please don't forget stop loss and capital management
When we reach the first target, save some profit and then change the stop to entry
Comment if you have any questions
Thank You

API3 Analysis: Possible Scenario for Bull-RunAPI3 is on the verge of breaking through a long-term resistance level. I expect the price to make another low before starting a move from the support level at $1.53. The targets I have in mind are $14 and $27

#API3/USDT#API3
The price has been moving in a bear flag since July 2022
We have oversold on MACD.
And the moving of the 100 was broken strongly up
Current price 1.57
First Goal 2.20
Second goal 2.75
Representing 170% of the current price

API3 buy setupThe large API3 structure is Boolean.
Meta-targets can move by maintaining the swap range.
The swap zone overlaps with the previous BOS zone, creating a strong zone.
Closing a 4-hour candle below the invalidation level will violate the analysis
Note that the financial market is risky, so:
Do not enter any position without confirmation and trigger.
Do not enter a position without setting a stop.
Do not enter a position without capital management.
When we reach the first TP, save some profit and try to move the stop continuously in the direction of your profit.
If you have any comments please post them, comments will help us improve our performance
Thanks

API3 can 1400% in 2024, time to buy?API3 is breaking out of the falling wedge pattern on the weekly chart, which is a great sign of strength. We can see that the corrective Elliott Wave pattern WXYXZ is complete, and we are starting a brand new uptrend to an all-time high. I believe 2024 will be very bullish for this coin, so it is better to buy now when the price is still cheap. We must also look at the volume indicator. We can see that the bullish volume is much higher than the bearish volume, which gives us confidence in this trade. Let me know what you think about my analysis, and please hit boost and follow for more ideas. Trading is not hard if you have a good coach! Thank you, and I wish you successful trades.
What Is API3 (API3)?
Smart contracts often struggle to access dependable data, but application programming interfaces (APIs) have been touted as a solution to this problem.
API3’s stated goal is to allow decentralized versions of APIs to be built, managed and monetized at scales. As blockchain technology plays an ever bigger role in the economy — from decentralized finance to supply chain management — the team behind this project says it has never been more important for smart contracts to provide “timely, reliable real-world data.”
The whitepaper for API3 was unveiled in September 2020 and set out the main problem that’s associated with APIs at present: connectivity. At present, there’s no way for smart contracts to establish a direct connection with APIs for the latest data — and this has led to an explosion in the popularity of oracles.
Although this has helped solve the problem to some extent, the industry has since been grappling with the “Blockchain Oracle Problem.” Oracles are a form of middleware that sit in between APIs and smart contracts — increasing costs and centralization. API3 intends to get around this problem by enabling API providers to operate their very own nodes.
API3’s token went live at the start of December following on from a token sale that generated tens of millions of dollars.
Let me know what you think about my analysis, and please hit boost and follow for more ideas. Trading is not hard if you have a good coach! Thank you, and I wish you successful trades.

#API3/USDT#API3/USDT
The price has been moving in a bearish flag since July 2022
Moving average 100 was broken
Current price 1.61
First goal 2.43
Second goal 2.95
Which represents 200% of the current price

API3 ANALYSISAPI3 has broken the trigger line and has a bullish CH. It has two liquidity pools at the bottom, if it sweeps these pools and then hits the support we are looking for, it could move well up.
If it returns to the green range, we will look for a buy/long position. The target range is red. This icon should be on your watch list.

API3 LONG SIGNAL 30MINHello dear traders
In api3 currency, we can look for long positions in 15 and 30 minute time frames.
The formed pivot has good credibility and even though the trade is in the opposite direction, there is a possibility that the price will grow.
Thank you for your support
Be profitable and happy

API3USDT analyzing the Potential Upsurge🚀🚀Analyzing the Potential Upsurge of API3USDT:
API3USDT, currently priced at $1.068, exhibits several indicators that suggest the possibility of an upward trajectory in its value.
1. Steady Price Growth**: Over the past few weeks, API3USDT has demonstrated a consistent pattern of price growth. This steady increase in value can be indicative of growing demand and positive sentiment among investors.
2. Support at Key Levels**: Technical analysis reveals that API3USDT has found support at key price levels, which has prevented it from significant declines. This support suggests that there is strong buying interest at these levels, reinforcing the bullish outlook.
3. Trading Volume**: An increase in trading volume often precedes significant price movements. If API3USDT experiences a surge in trading volume alongside its price increase, it may signal a more substantial rally.
4. Positive News and Developments**: Positive news surrounding the project, such as partnerships, technological advancements, or adoption in the blockchain space, can be a catalyst for price appreciation. Staying informed about recent developments in the API3 ecosystem is crucial.
5. Market Sentiment**: Monitoring social media channels and cryptocurrency forums for sentiment analysis can provide insights into how the community perceives API3USDT. Positive sentiment can fuel buying interest and drive prices higher.
6. Resilience to Market Volatility**: API3USDT's ability to maintain its value during periods of market volatility can be a positive sign. It suggests that the coin has strong fundamentals and a dedicated investor base.

Shorting API3USDTShoring API3USDT from 1.26
its long term bearish trend going on, sudden big hike of 50% is looking fake, I am in short with initial target 1.2 then 1.15 and 1 with extension
Good luck, Happy Shorting Weak Coins

API3 token formed bullish Gartley for upto 165% pumpHi dear friends, hope you are well and welcome to the new trade setup of API3 token with BTC pair.
In the previous trade we had almost 41% pump, and the priceline was very close to hit the sell zone, but drpped down just before reaching the target as below:
Now on a 4-hr time frame, API3 is about to complete the final leg of a bullish Cypher pattern.
Note: Above idea is for educational purpose only. It is advised to diversify and strictly follow the stop loss, and don't get stuck with trade

API3 token forming bullish Cypher for upto 12% pumpHi dear friends, hope you are well and welcome to the new trade setup of API3 token with BTC pair.
In the previous trade we had almost 41% pump, and the priceline was very close to hit the sell zone, but drpped down just before reaching the target as below:
Now on a 4-hr time frame, API3 is about to complete the final leg of a bullish Cypher pattern.
Note: Above idea is for educational purpose only. It is advised to diversify and strictly follow the stop loss, and don't get stuck with trade

API3USDT Falling Wedge!API3USDT Technical analysis update
Buy zone : $1.610 - $1.64
Stop loss : $1.49
TP 1 : $1.737
TP 2 : $1.855
TP 3 : $2.05
Always keep stop loss
Thanks
Hexa

API3/USD - Prepare the ROCKET SHIP!!! $3 in sight!Second try a success? 👇
API3 was rejected at first try to break the neckline, another attempt soon.
If successful, prepare the rocket ship. 🚀🚀🚀
API3 can easily go to $3 or above.
Like and follow if you liked my idea!

Api3/Usdtapi3 in entry price You take from this Lvl targets in chart & stop close 1 hour below green line
good luck everyone

API3API3/USDT forming Massive Rising Wedge pattern downfall will be amazing just waiting for retest on Resistance Zone i expecting 50% price to drop

API3API3/USDT five time didnt breakt Resistance Zone now its going to see one more time if he can break but i dont thinks and this time coin cant break this resistance zone we are waiting to see next move
Comment Below what do you think

API3/USD - Next Resistance at $2.3 & $3.3 😎API3 has reached a local bottom and a relief rally is in order.
The current support at $1.2 meets at the intersection of two key levels, first the trendline since API3 was released as well as a perfect 1:1 extension from the previous top.
The key levels to watch as the price moves higher are at $2.3 and $3.3.
A price above $3.3 seems unlikely unless BTC somehow manages to push above $40k.
Bias is bullish short term, but I would not expect more than $3.3 in the current market.
Keep an eye on this.
Like and follow if you liked my idea!

🚀🆙 $API3 ..Bullish ASF!!!Simply put $API3 Looks Bullish asf on the daily & 3day time frame.
One of the most bullish charts I've seen this week and there's no stopping it!
Get past $6.5 it's going to $9.8-$10.. possibly even $11.
Just Remember don't fomo and always take profit!

API3USDT - hello crypto lovers
- ahmed signals team wishes you high profits
------------------ API3 USDT ----------------------
_ buy : 4.55
| TP 1 : 4.83
| TP 2 : 4.96
| TP 3 : 5.33

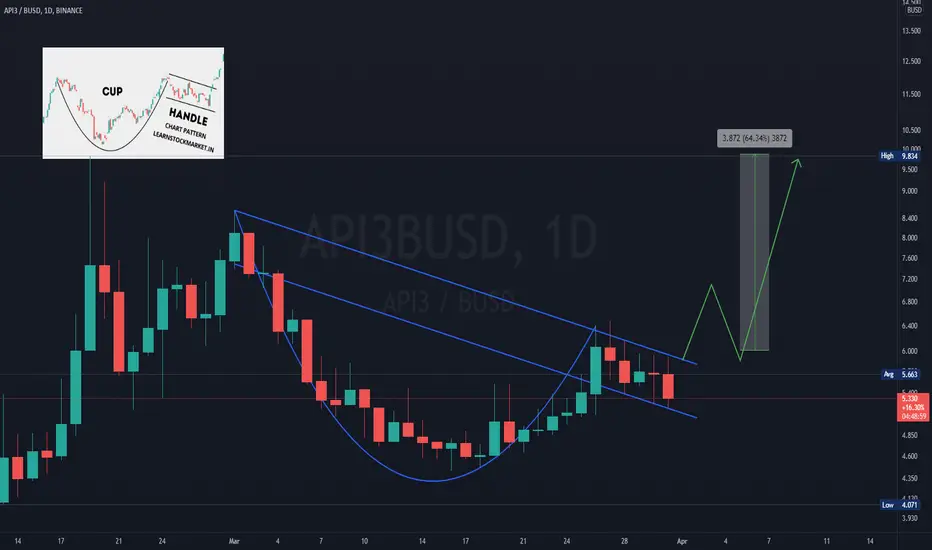
#APi3 Cup and HandleAPI3 MAssive Cup and Handle
Handle counting as a bullish flag now, waiting to break above the neckline and send it to 10$
API3 formed bullish Gartley for upto 168% moveHi dear patrons, hope you are well and welcome to the new trade setup of API3 token with US Dollar pair.
On a daily time frame API3 has formed bullish Gartley pattern.
Note: Above idea is for educational purpose only. It is advised to diversify and strictly follow the stop loss, and don't get stuck with trade
