Apple DOWN! Not Fruits or healthy food in MC DONALDS.We can see the selling volume some days ago, that was an important one, ¿WB?
Apple is retesting as the whole S&P seems to chop chop this quarter, remember that was going up when Crypto was Chopping.
Opened the short yesterday, with a tight SL just in case-
Let´s see.
Para pa pa pa Loving IT
APPL

APPLE What Next? BUY!
My dear friends,
APPLE looks like it will make a good move, and here are the details:
The market is trading on 225.00 pivot level.
Bias - Bullish
Technical Indicators: Supper Trend generates a clear long signal while Pivot Point HL is currently determining the overall Bullish trend of the market.
Goal - 229.14
Recommended Stop Loss - 222.52
About Used Indicators:
Pivot points are a great way to identify areas of support and resistance, but they work best when combined with other kinds of technical analysis
———————————
WISH YOU ALL LUCK

ETH/BTC Inverted - Apple / Blackberry. Times different?
Don't follow alt coins much nor Ethereum but I decided to check out the ETH/BTC pair inverted it and found a very strong similar pattern that Apple and Blackberry made after the dotcom bubble.
Apple as the strongest competitor in the smart phone scene left Blackberry spinning in circles with a last jump to try gain market share resulting in a fail of the share price.
Today? we see Ethereum playing out in similar fashion where Bitcoin started then Ethereum tried to tail the success of Bitcoin's innovation.
PoS could be similar to trying to put a physical keyboard on a smart phone.
If this is the case and Bitcoin goes on the run I expect it to, this could be the final wave of Ethereum's market share.

Is there an AI bubble around the corner?Are semi conductors forming a rounded top or will they bounce on the trend support line? If you are even asking yourself if this is a serious question you are probably already late. get your calls asap. don't wait for the trend line support bc semi conductors are leading the way into AI. looking at the 265 calls sept 27 at the open on monday...

APPLE Stock 22% Gain - Profit Target 2 Reached!The APPLE stock price crosses over the Risological swing trader dotted line on on May 3, 2024 giving us a clear bullish trade setup.
LONG Trade Setup
Entry 185.5
Current trailing stop loss at : 203.6
Overall gain from the entry: 22%
Last profit target is at 254.5
Congratulations, who made profit!

Apple is a great buy once it exceeds 240!
The stock experienced an extended period of consolidation, during which it formed several bullish chart patterns, including the Double Bottom and Rounding Bottom.
After the price broke above the neckline of the Rounding Bottom, the stock surged to reach an all-time high close to the 237 level.
Since then, it has retraced nearly 17%-18%, returned to its support level.
Now, with a robust rebound underway, the stock is approaching its resistance zone, and there are strong expectations for a significant breakout.
The optimal buying opportunity lies just above the 240 level.

APPLE: Market Sentiment & Forecast
Balance of buyers and sellers on the APPLE pair, that is best felt when all the timeframes are analyzed properly is shifting in favor of the buyers, therefore is it only natural that we go long on the pair.
❤️ Please, support our work with like & comment! ❤️

Apple stock is flying nice to try nowBroke out of the all time high level. Since in september new apple products will be availabel for sale and AI things around Apple will trigger this stock.

AAPL Signals Short Term DropOf the 71 times AAPL triggers a sell on my RSI indicator (the magenta arrow at the bottom of the chart), the stock drops 97.143% of the time in the following 25 trading days. During 37% of the successful drops, the stock moves upward for 1-4 more days after the signal occurs in what I call the delay period.
What qualifies as a successful drop? The sell signal was triggered based on the closing price of AAPL stock on July 10, 2024 at 232.98. This means 97% of the time the stock will move below this closing price in the near-term. 2.85% of the time, the stock does not drop below this price over the following 25 trading days. The stock has always dropped below the signal closing price by at least 0.266% over the next 100 trading days.
On the chart above, the red boxes at the top are the delay zones of interest. The larger red box contains 100% of all delayed movement. The smaller box contains the stock's top or peak of the delay for 50% of the occasions. The same holds true for the two large green target boxes on the bottom. The final downward movement bottoms in the smaller green box 50% of the time, while the much larger green box contains bottoms or valleys for all downward movement.
This delay period of potential continued upward movement has historically had a maximum 3% gain before the stock eventually dropped. Regarding the bottom of the drop. Over the next 25 bars, it can occur on any day in the range with the median bottom occurring by day 8. 75% of the bottoms have occurred before day 18. The stock drops a minim of 0.266%, and median of 5.021%. 25% of the bottoms are no lower than 2.152%, while 75% of the drops are 8.3% or less.
The four shallowest drops over the next 25 days have been 0.266% (September 2010), 0.312% (February 2017), 0.827% (March 2019), and, 0.868% (August 2020) while the four deepest drops have been 63.23% (August 2000), 26.58% (December 1999), 26.51% (January 2006), and 24.80% (September 1999). The most recent double-digit percentage drop was 15% in April 2019. All shallow drops occurred in the most recent strong bull market, while the largest drops were part of the dot-com bubble burst.
While this current potential drop will likely avoid the sharper end of sell-offs, it is always interesting to see the strength and accuracy of signals. Historical movement is not indicative of future movement, but it is good to have as a data point.

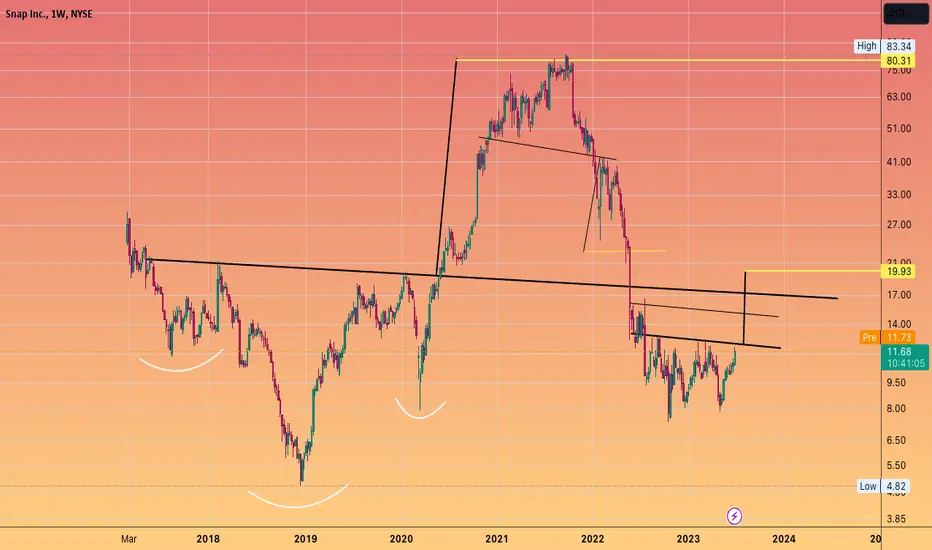
$SNAP Bear to Bull reversal in progressLate cycle
catch up momentum play?
seems likely
#APPL is closing in on $200
could that push the laggards higher?
Big Tech is nearly at All time High's. Just 3% away!It has doubled since the peak Recession fears of 2021
#BTC has also more than doubled
#SOL has 4 or 5 X'd
This chart is combined price chart of
#Googl
#Appl
#MSFT
#Amzn
#NVDA
#NFLX
#META
U can see the two head and shoulder tops in 2021
and also the inverse head and shoulders in 2022
The clean break and run.
And also the Bull Pennant which has already bullishly triggered 3 weeks ago.
From these levels if that Bull pennant target is to be met (log scale)
It seems this basket has another 30% move left in it.

AAPL or Apple shares Buy PossibilityApple shares had same negative news, lawsuit and such.
We see a nice defensive support line around 169.35, we have gone up from here before.
Simple 1/1 ratio stoploss to take profit back to the 2 previous tops.

Market update- Mara & BTC focused.Not typing anything. Watch the video.
Not sure why I need to have a certain amount of text for a video idea. But oh well.
Filler text: gerhkfgrhkfewhjklfew
bhnkgwerbhnkgrwhjkng
njgrwknjlgwre

Testing Vix Cheat Sheet on Apple, 5 days + 4.11%The Viz cheat sheet indicator reveals that if the Vix closes above the upper Bollinger band ($19.01) during the next 5 days that means the Apple stock price will increase by 4.11% to $174. Currently the Vix is around $18.
I've tested this indicator the Vix cheat sheet before with quite impressive results.

Apple (AAPL): Rangebound with Support in Sight?Key technical levels and potential price swings for Apple stock.
Apple (AAPL) has been trading sideways within a well-defined range of roughly $168.25 - $197.30. The recent price action has seen the stock gravitate towards the lower boundary of this consolidation zone.
Technicals hint at a potential reversal:
Given the stock's close proximity to support around $168.25, a rebound back toward the weekly pivot point could be on the horizon. This would align with a return to the midpoint of the established trading range. Additionally, the presence of a double-top pattern near the upper end of the range bolsters the support argument.
Breach of support could trigger a selloff:
However, a break below the critical $168.25 level could ignite further selling pressure, potentially pushing the stock lower. Notably, a breakdown below the neckline of the double-top formation would provide a strong bearish signal, significantly increasing the likelihood of a more substantial decline.
Disclaimer: This analysis is for informational purposes only and should not be considered financial advice. Please conduct your own research before making any investment decisions.

APPLE STOCKS HOLDING SUPPORT!! HI TRADERS
As i can see APPLE Stock is holding this support and new products are coming in market to boom the APPLE Stock Prices technically also it is holding on support our risk rewards ratio is fantastic on this & its just a trade idea shares your thoughts with us we appreciate Ur love and support stay tuned for more updates.

APPLE SHORT Below $178If APPL keeps dropping and gets below $178 I think this could be a very good short. I already took a small position, not financial advice. DYOR. Might be a little premature , above $190 would invalidate this.

Apple's Vision Pro Faces Early Adoption WoesAs Apple's Vision Pro makes its debut in the world of augmented reality headsets, the honeymoon phase seems to be over for some early adopters. Amidst the buzz surrounding its groundbreaking technology and futuristic capabilities, a vocal subset of users has taken to social media to voice their grievances, painting a nuanced picture of the device's shortcomings.
One of the primary issues plaguing Vision Pro users is comfort—or rather, the lack thereof. Reports of headaches, motion sickness, and discomfort abound, with many attributing these symptoms to the headset's weight distribution and strap design. The Verge's product manager, Parker Ortolani, even went as far as to suggest that prolonged use led to a burst blood vessel in his eye—a sobering reminder of the potential health risks associated with wearable technology.
However, discomfort isn't the only hurdle facing Vision Pro users. Many have expressed disappointment with the device's perceived lack of productivity features relative to its hefty price tag. From difficulties multitasking between windows to limitations in file compatibility, users like Carter Gibson of Google have found themselves grappling with the finer details of everyday tasks, leaving them questioning the device's practicality in a professional setting.
But amidst the chorus of complaints, there remains a glimmer of hope for the Vision Pro's future. Despite their grievances, many users express a willingness to give a second-generation model a chance, highlighting a lingering optimism for improvements in comfort and functionality. Moreover, some argue that the device's shortcomings lie not in its technological capabilities, but rather in the absence of a compelling killer app—an elusive factor that could potentially propel the Vision Pro into mainstream success.
Yet, as the debate rages on social media, the true extent of the issue remains shrouded in uncertainty. While anecdotes of returns and frustrations proliferate online, concrete data on return rates and Apple's internal expectations for the Vision Pro remain elusive, leaving the full impact of these early adoption woes open to interpretation.
In the rapidly evolving landscape of wearable technology, Apple's Vision Pro serves as both a testament to innovation and a cautionary tale of the challenges inherent in bringing cutting-edge devices to market. As the tech giant navigates the delicate balance between pushing boundaries and meeting user expectations, the fate of the Vision Pro hangs in the balance—a high-stakes journey fraught with both promise and peril.

APPLE Bullish movementAPPLe has successfully tested the support level of 180 and did a bounce back
The previous HL was defined at 180 level
Now the bounce back is a strong bull movement towards Earnings on 1st Feb
it can easily reach 200 level
Entry @ 191
Stop loss @ 175
TP 1 @ 200
TP 2 @ 220

"Apple Inc. (AAPL) Potential Upside "Apple Inc. (AAPL) Potential Upside: A Fundamental Analysis"
I believe Apple (AAPL) presents a promising opportunity with potential benefits and risks.
**Trade Idea:**
- **Entry:** Current market price
- **Stop Loss:** $172.08
- **Target:** $190/$200
**Fundamental Benefits:**
1. Strong financials and consistent revenue growth.
2. Robust product portfolio with a loyal customer base.
3. Potential for positive developments in upcoming product releases or partnerships.
**Fundamental Risks:**
1. Market volatility and macroeconomic factors may impact stock performance.
2. Dependency on a few key products, making the company vulnerable to market shifts.
3. Regulatory challenges in the tech industry could pose threats.
**Disclaimer:** Always conduct thorough research and consider your risk tolerance before making any investment decisions. This idea is for educational purposes only and not financial advice.

APPLE Technical Analysis! BUY!
My dear friends,
APPLE looks like it will make a good move, and here are the details:
The market is trading on 171.20 pivot level.
Bias - Bullish
Technical Indicators: Supper Trend generates a clear long signal while Pivot Point HL is currently determining the overall Bullish trend of the market.
Goal - 179.82
About Used Indicators:
Pivot points are a great way to identify areas of support and resistance, but they work best when combined with other kinds of technical analysis
———————————
WISH YOU ALL LUCK

September 23 - Week 3: ThoughtsStill a defensive week. We will see what happens with the Fed Reserve stuff tomorrow.

TSLA NVDA AAPL MSFT AMZN META GOOGL Price ForecastWelcome to the daily how to make money online with stock market Mega Cap 7 Tech stock, Nvidia Microsoft Google Apple Amazon Meta Tesla Stock, Technical Analysis Show where I break down the price action and let you guys know what the most likely scenario I think will be going forward.
00:00 QQQ Forecast
06:55 Sp500 ETF analysis
09:54 Tesla Stock TSLA Forecast Technical Analysis
11:21 Nvidia Stock NVDA Forecast Technical Analysis
13:45 Apple Stock AAPL Forecast Technical Analysis
14:45 Amazon Stock AMZN Forecast Technical Analysis
16:34 Google Stock GOOGL Forecast Technical Analysis
17:43 Microsoft Stock MSFT Forecast Technical Analysis
19:17 Meta Forecast Technical Analysis
