The Apple An opportunity is coming for the apple stock to catch a nice bounce from a support that must show up around 140-145
APPL

GOOGL: Leading Tech Stocks to break above clouds!Alphabet (GOOGL), the holding company of Google, has broken above the weekly Ichimoku cloud. Apple, Amazon and Facebook will soon be making attempts to do so. Watch out above!

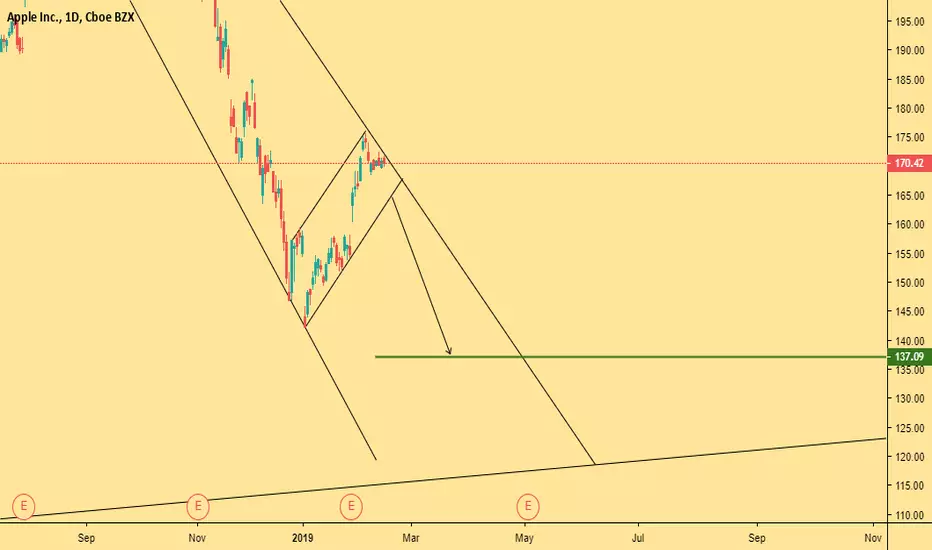
Potential -%35 Drop APPL R/R:10 ST1Top of Wedge's Channel,
Sell The News.
P.S.:This is my first Stock chart. Please don't take this as financial advise.

APPLE (APPL): The biggest dump in historyAPPL has suffered the biggest dump of shares in its history. Price has bounced back by still less than a 38.2% retracement (at this time). Now price is struggling at a key inflexion point. Will APPL recover? I don't know - as I cannot see into the future. The probability estimate at this time is further downside eventually on the weekly to 3-Daily.

Apple Inc. (APPL) Will Also Crash (& More)Apple Inc. (APPL) and basically, most of the conventional market will crash really soon (according to the signals and patterns that I seeing coming from the charts).
This is a friendly warning to all of my amazing supporters.
(I LOVE YOU... THANKS A LOT FOR YOUR CONTINUED SUPPORT)
It will be interesting to see what effect this has on cryptocurrency.
Will cryptocurrency move up while the conventional markets go down, or will cryptocurrency follow the conventional markets?
Many altcoins charts are setting themselves up for a big jump.
Bitcoin is looking a bit bullish short term (60/40 between Bullish/Bearish), but it can go either way. So it will be interesting to see how it moves when the conventional markets start to crash.
What's your take on the upcoming crash and the effect that it might have on cryptocurrency?
Feel free to share your thoughts, if you like to, in the comments section below.
Take 10 seconds of your time to hit LIKE... Thanks!
Namaste.

DOW JONES Future Market Cycle Prediction: 40 Year Depression In great world super powers, there is,always a rise and a gradual decline
and then another country becomes a superpower.
Market Cycles Charts shows This is for the most part on how the economy of any civilization
works from it's onset
to it's eventual collapse.
World History proves it again and again.
the above chart Shows
A detailed history of major U.S. historical events against the DJI
It appears the U.S. only instigates wars & Uprisings during their corrective cycles,
The United States,has and will always meddle with the affairs of other nations since it became a world power. I remember the Cuban missile Crisis, the Vietnam war, the US backed puppet govts of South America who come and go at the bidding of the US deep state CIA. I have been witness of how they wanted to get China through their puppet Chiang Kai Shek, but Communist Mao tse Tung was a far better tactician and won the hearts of the people, I have known how the US instigated wars and uprisings in countries the leaders they dont like, like Iraq's Saddam Hussein, Libyas khaddfy, and lately Syria's Al Assad. Now they're doing same to Venezuela. What else is new?
So How do we protect ourselves, our families & the little assets we have in a event that we experience the deep decline caused by inflation and or Hyper Inflation like what they're getting in Venezuela Where People are killing each other for a bag of rice, food & or water?
Well the short answer for that is learn to grow your own food and stockpile on years/ months long supply of water
Live one day at a time, enjoy life moment to moment and hope and pray for the best and work for a better tomorrow. Countries rise or fall, but people are resilient and learn to adapt. Take the ice age before, that was more than.turbulent, but human beings had to survive and adapt and kill mastodons to survive and survive they did.
Same with the desert people the Bedouins who can do without water for days and live on camel's milk or cactus.

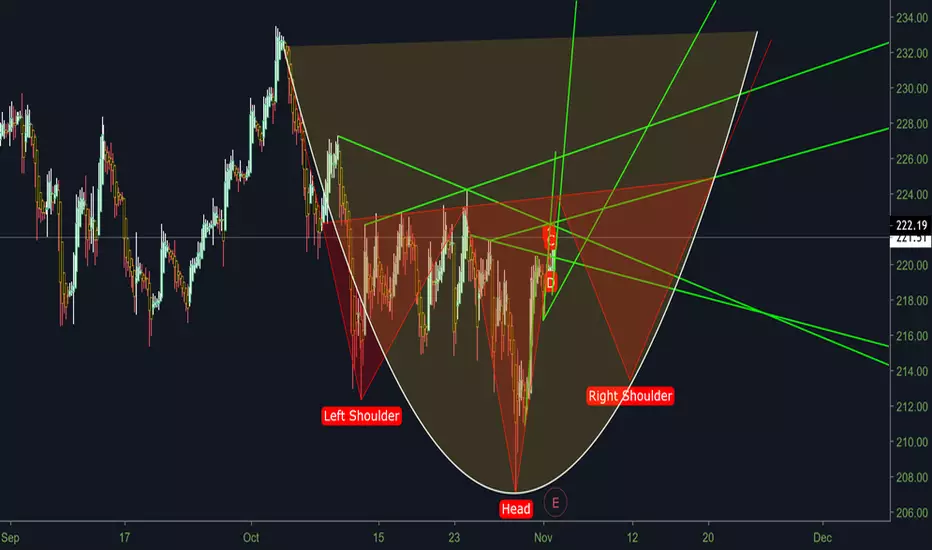
$SPY pattern HEAD & SHOULDERS With the government coming back from the longest shutdown in history. We could still be expecting blowbacks from the affected sectors and companies. So what better pattern to complete this mash-up than a head and shoulders.

Taiwan Semiconductor (Reversal)TSM is moving towards a key resistance level which could in-turn create a reversal. That level is just under $39.00. Big tech companies are anticipating the release of 5G, so most if not all mobile devices will have capabilities and Qualcomm which is a customer of TSM will be producing a lot of chips.

Nasdaq Roadmap to life changing wealth (Macro Play)Ok guys, I have been watching the U.S equities for a while now and I have proposed a price method that we very well might see play out.
If you have any comments or ideas your self leave me a comment down below.

SELL O BUY? APPLE!vemos a apple , en una tendencia bajista , la cual puede ser quebarada para posteriormente ir rompiendo . resistencias y subir el precio , esperemos buscar largos a la rotura del 154 , de lo contrario no operes largo en el mercado!, recomendaciones de cortos en la directriz bajista!

618 Bounce Looking at Apple:
Made a 618 retracement
Volume building up
Bullish divergence on histogram
Willy stupidly over sold
A bounce to the 382 or 618 is possible
I would like to see a double bottom on the 618 to continue higher
VPVR has a notch at 137
* Don't forget to hit that like button and follow me on Trading View for more chart analysis :)

Apple, Buy Signal.We can open buy near $145 - $150
The price can move up to $180 - $185 because:
- Stock rate bounced from a very important level, 50% of the previous UpTrend (Since the 2012 year).
- Low risk and predictable stop Loss.
- Company earnings are growing.
After 75 like, I will write all entry end exit points. And places where is the best set Stop Loss.

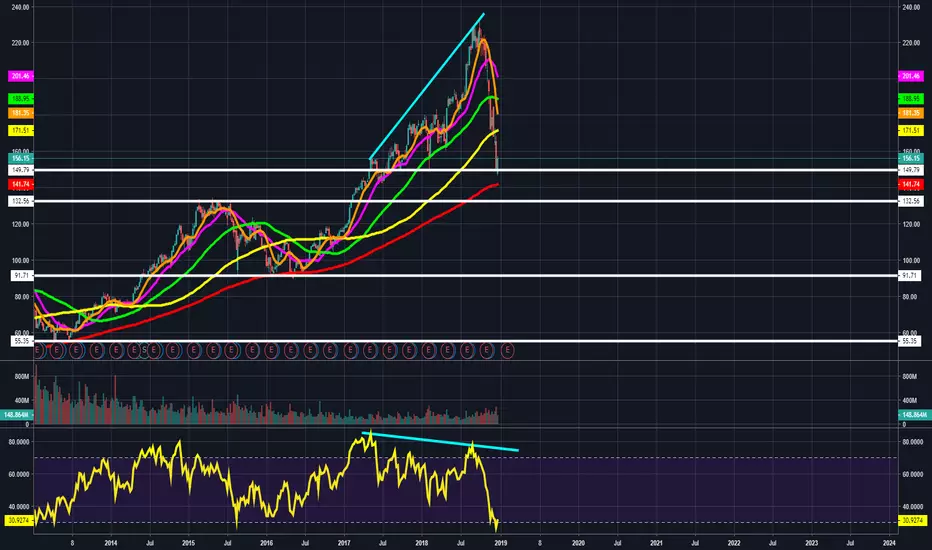
Don't be fooled by a dead-cat bounce. More downside possible.APPL got a nice dead-cat bounce off of a prior support zone we saw it hold back in September of 2017, and in February of 2018, and it was fairly close to the 200 weekly moving average. However, we also saw come clear bearish divergence form over the last few months/week (shown by the light-blue lines on the price action and on the RSI); as for the price made an eventual higher-high, but the RSI made a lower-high, indicating the trend (upwards at the time) was weakening, and we saw the price drop dramatically there after. I still think a lot of these stocks are over-valued, and have plenty of room to fall. Ignore the noise from the main stream media and the big-time investment firms that tell you these prices are "deals, steals, bargains, good buys" and whatever other phrases they enjoy throwing at you in a bid to get you to buy something. I will change my stance if we get above (and hold as new support) several key moving averages. If we cannot, then I'm watching for a break below the 200 weekly moving average, and a break below the support zone around 130-135. Overall, I continue to remain bearish.
Moving average guide (All in the weekly time-frame for this chart):
10 MA in Orange
20 MA in Pink
50 MA in Green
100 MA in Yellow
200 MA in Red
-This is not financial advice. Always do your own research and own due-diligence before investing and trading, as for investing and trading comes with high amounts of risk.
Dow Stocks Apple (APPL)This is an interesting one coming into focus more in the last decade , the crash used was the 2000, as it had the highest percentage drop.
Blue == Monthly
Red == Weekly

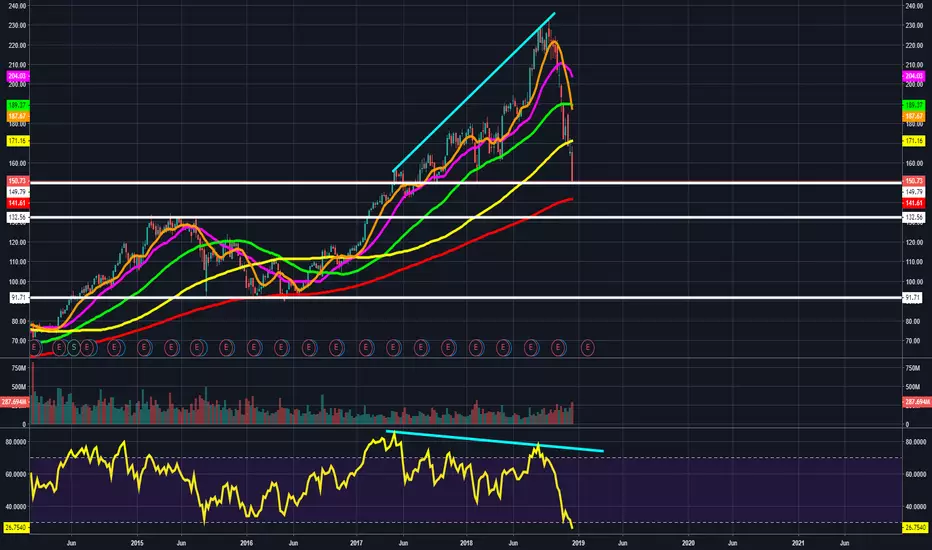
APPL nearing the 200 weekly MA. Bearish sentiment remains.APPL has been on an all out waterfall these last 2-3 months. Price action is currently holding a prior support zone that we saw it hold back in February of 2018, but I think we will see APPL retest the 200 weekly moving average, and if we break below it, we could be setup for more downside. In line with several other stocks I've done Tradingview posts on, APPL also had clear bearish divergence form. We saw price action make a higher-high, while the RSI made a lower-low (as shown by the light-blue lines on both the price action and on the RSI.) There is a possible support zone around 130-132 should the 200 weekly MA get purged, but I'm really watching that 90-95 dollar area, as for we saw it hold on 4 separate occasions back in 2015-2016, but I wouldn't put too much emphasis on it just yet, and would focus more on the price action and the overall market sentiment.
What to watch for:
-Retest of the 200 weekly MA. Watching the 90-95 dollar area specifically as we saw it hold on 4 separate occasions back in 2015-2016 if price starts to drop. Remember, this may take weeks/months to play out. Viewing this from a more macro perspective.
APPL Testing Support, Potential Bounce!APPL is testing its support at 162.52 (61.8% Fibonacci extension, 50% Fibonacci retracement, horizontal swing low support) where price is expected to bounce up to its resistance at 182.43 (horizontal overlap resistance).
Stochastic (89, 5, 3) is testing its support at 1.9% where a corresponding bounce is expected.

APPL Approaching Support, Potential Bounce!APPL is approaching its support at 162.52 (61.8% Fibonacci extension, 50% Fibonacci retracement, horizontal swing low support) where it could potentially rise to its resistance at 185.73 (horizontal overlap resistance).
Stochastic (89, 5, 3) is approaching its support at 1.94% where a corresponding bounce could occur.

APPL Approaching Support, Potential Bounce!APPL is approaching its support at 162.52 (61.8% Fibonacci extension, 50% Fibonacci retracement, horizontal swing low support) where it could potentially rise to its resistance at 185.73 (horizontal swing high resistance).
Stochastic (89, 5, 3) is approaching its support at 1.9% where a corresponding bounce could occur.

APPL Approaching Resistance, Potential Drop!Apple is approaching resistance at 182.31 (61.8% Fibonacci extension, 23.6% Fibonacci retracement, horizontal overlap resistance) where it could potentially drop to its support at 162.52 (horizontal swing low support).
Ichimoku cloud also shows signs of bearish pressure.

APPL - given the 'Newton' treatment by investorsApple - has had to obey the laws of 'physics'. Basically the higher you go the harder you fall.
People are of course living on hope - as you would if in a plane crash (by way of analogy only).
I'm afraid the outlook isn't pretty - and that's not what people want to hear about. People need hope. Apologies. I only provide reality. I say what's on the charts. Trading is about harsh realities.

APPLE - Supercycle Wave 1 Extending - HOLDAAPL is a HOLD.
Super-cycle Wave 1 wants to extend.
Will update.
-AB