GRAVITY MAKING APPLE FALL,.NASDAQ:AAPL
Be a newton and take advantage of falling apple in the stock market.
I see that daily support is broke already and it is going for a retest the trend line now so get ready to grab the chance.
target have been market and stoploss is must.
All the best have a profitable week.
Apple

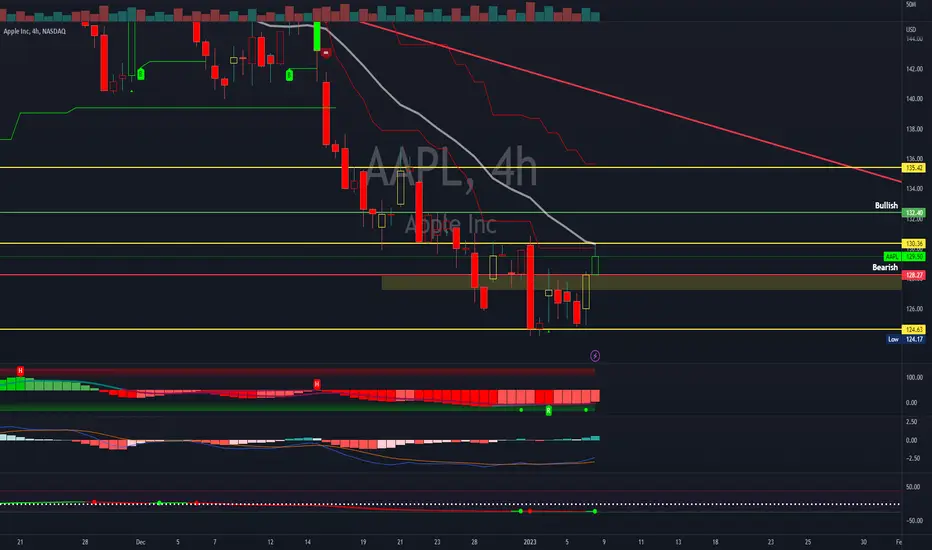
Apple has some work to doLooking at $AAPL it is going to have to prove that it can hold this support above 125. Looks like we filled the imbalance completely and loss support. Can they hold above 130? Well if not look for it to retest 125 again!?! But this time it might be enough to have it fall to new lows. The rejection of the EMA coincides with this theory.
Bullish Case 128 is a key level to have higher lows show up on lower timeframes. I this the rejection is the rest of the order waiting to fill between 127 and 128. Look for the bounces here.
Bearish Case 130 psychological level has proven sell orders waiting there. 128 won't hold as this is the top of a range. This is something to play back down to 125.
ApplesauceHere are some levels for $AAPL I’m eyeing.
The EMA 200 might give some bounce. Also keep in mind earnings on February 2nd.

Potential Cup and Handle Forming on AAPLLooking at the 15 & 5 min chart for the weekly, I can see a potential break out of the handle. I drew a small trend line and buyers have remained over it for the last 30 minutes.
I am not the greatest charter, but this looks bullish to me, maybe moving into tomorrow or early next week. What do you all think?

Inari Simple Chart AnalysisInari - Rst 2.8 area. Supp 2.6 area.
Red chip appearing. Worth to monitor if klse tech can come back.

Apple long ideaApple weekly Chart showing a huge consolidation.
As bad as it is, i'd probably take a shot if it can get to $120 or lower. Maybe swing March $125 call. Let's see how it reacts to Fed announcement this week.

What Billionaires Taught me About TradingDid you ever wonder why influential people wear the same clothes every day?
• Mark Zuckerberg wears his famous round neck grey t-shirt.
• Richard Branson wears his famous pair of jeans.
• Steve Jobs wore his black turtle neck.
• Barack Obama wears either his blue or grey suit.
Well other than promoting their signature look, there is a much more deeper and important reason for it…
You might want to consider this analogy for not only trading, but for every important aspect of your life.
Why Mark Zuckerberg wears the same outfit
Facebook CEO, Mark Zuckerberg held the first ever public Q&A session at FB California headquarters in November 2014.
During the hour session, he was asked why he wears the same grey t-shirt every day.
Here was his answer:
“I really want to clear my life to make it so that I have to make as few decisions as possible about anything except how to best serve this community,”
“I feel like I’m not doing my job if I spend any of my energy on things that are silly or frivolous about my life,”
Less decisions – More success
This concept to make one decision on what outfit to wear, is to help prevent ‘cognitive fatigue’.
One less decision to worry about in life will save your brainpower capacity to help make decisions that matter for the future.
Besides, the more decisions you make – the more complicated life is.
Ok, so you got the gist…
Here’s what this lesson taught me about trading
As a trader, there is plethora of events taking place every day.
There are countless factors to consider:
• Markets
(Forex, shares, indices, commodities and cryptos)
• News events
(Employment, GDP, macro & micro announcements)
• Indicators
(Moving averages, RSI, MACD, Price action etc…)
• Time frames
(Tick, 5 minutes, 30 minutes, daily, weekly)
• Strategies
(Moving average crossovers, breakout patterns, volume analysis)
It’s enough to test everything until the end of time!
That’s why, I have personally worn the same metaphorical outfit for the last 14 years.
NOTE: It took me 7 years to find this outfit!
1 Strategy – MATI Trader System
1 Time frame – Daily
1 Indicator – Price action
1 Risk level – 2%
1 Financial instrument – CFDs
It’s all about finding what you find comfortable, consistent and sustainable…
How to find your one outfit when you trade
This is most definitely a self-introspection journey to find the ‘outfit’ you will be wearing as a trader.
To start, write down your trading strategy and markets you want to trade…
My biggest tip – Keep it simple, minimalistic and comfortable…

sell the big capsApple brought forward so much demand, how many iphone and tablets do you need to buy in 2023?
Corporates are pretty much done with buying new iPhone for employees as a benefit, they will prioritize pay increases and cash flow instead! Western consumers have taken a huge hit on their disposable income, I cannot see them lining up for an incremental phone when their 3 year old phone is frankly more then good enough.
Apple is about to break its' 2009 trend line, and start afresh! For Apple to recapture its growth perspective, it needs to be the NEW Apple, or Apple after the iPhone, and I think it will do exactly that! Apple will be an amazing purchase as I am big believer in its product line up, as I am an ALL in Apple consumer.
Apple and Microsoft has some of the higher multiple for the top 5 tech stocks. In 2000, the 5 tech stocks represented nearly 20% of the S&P, by 2003, they were down to only 5%. In 2021, FAANG represented nearly 25% of the S&P, where will they end up? I would probably say around 5-10%....

Apple. World largest stock looking for new “host?” 4/Jan/23AAPL, apple as world largest market cap stock in the world benefiting from “low rate” for past 40 years. Howard Marks have “ warned” the end of 40...Probably capitalist might take few years ( consolidation in most equities market) looking for “new boss”.?

$AAPL DIAMOND - TRIANGLESubjective to weather it’s a diamond or triangle but breakout here is clear and the move has already happened. Looking for a reversal bounceback. Short term

Apple ~ Swing Short in PlayExpecting Mid Range ~ 166 soon, and if that breaks, will open gates to lower 150-155

Apple Inc AAPL Monthly Chart ReviewHello friends, today you can review the technical analysis idea on a 1M linear scale chart for Apple Inc (AAPL).
The AAPL price chart is self-explanatory. Price looks concerning as it has been moving significantly higher over the past few years. I put a few trend lines and support lines that will be very important as the price retraces. Included in the chart is the 20, 50 and 200 SMA, Volume, RSI and Volume Profile (VPVR).
If you enjoy my ideas, feel free to like it and drop in a comment. I love reading your comments below.
Disclosure: This is just my opinion and not any type of financial advice. I enjoy charting and discussing technical analysis. Don't trade based on my advice. Do your own research! #millionaireeconomics


Apple is near key levelsFirst of all, forgive me to draw so much in this chart but AAPL is on fire and we've to take a close look to price movements because we could see awesome opportunities soon.
We all know AAPL, amazing business, great margins but now suffering some issues with production that can lead to some volatility.
In this chart, you can see:
1. A very big historical bullish channel in grey that give us resistance prices in the 100-110$ level.
2. An amazing expanding triangle unfolding with potential price objective at 100-110$ zone. Take care, I'll explain further this price formation and why it could end at 120 or 115$ the movement.
3. The RED danger zone explained in the idea of few days ago. The break of this support led to -7% returns by now.
4. The small downtrend blue line that was our previous idea. We expected a bullish break that never happened, instead we've seen the break of the danger zone support, so our mind is bearish since then in AAPL. (Please see previous idea to understand this in detail).
5. Some blue lines that are major resistances, the lowest one in the 105-110$ zone. Note that this is also the expected zone of 1 and 2.
Expanding triangle explanation
An expanding triangle is a chart pattern that occurs in a trend and is characterized by a series of higher lows and lower highs. This pattern is formed by two trendlines that converge towards each other as the price moves in a wide range. The upper trendline represents resistance and the lower trendline represents support.
As the price approaches the apex of the triangle, it becomes increasingly volatile, and a breakout is likely to occur. If the price breaks out to the upside, it is a bullish sign and may indicate that the trend will continue higher. If the price breaks out to the downside, it is a bearish sign and may indicate that the trend will reverse.
The consequences of an expanding triangle in the market depend on the direction of the breakout and the strength of the trend leading up to the pattern. If the breakout is strong and the trend is bullish, it may lead to further price increases. If the breakout is weak and the trend is bearish, it may lead to a reversal or consolidation in the price.
By now, we see a wave 3 which is 1,618 times the first wave. We expect a wave 5 which could be 1,618 times the wave 3, this would move the price to 110$, again this zone... Take care, by now wave 5 is slightly more than 100% of wave 3, so the triangle could end at any time, but for us makes sense to wait for lower prices to have a better risk reward ratio.
Ahead we have 120$ and 115$ levels which are also important previous supports and resistances and could lead to some bounces or eventually to the end of the pattern. Let's keep watching!
Worst case
If the price loses the 105$ level, we have no historical volume until 80$ so a crash could happen easily. Anyway, the 105-110$ zone is strong enough to believe that demand will appear there and the expanding triangle could then be confirmed.

Apple Breaking to Resistance?This is a weekly chart of Apple (AAPL) as measured relative to the S&P 500 ETF (SPY).
The chart has been arbitrarily adjusted in magnitude (x1000) to improve visibility of price movement.
One should always analyze an asset's performance relative to the performance of the broader index before choosing to invest. If an asset is underperforming the broader index, one would be better off just investing in the broader index than investing in the underperforming asset.
Few people may have known that, under the surface, Apple has been resisted downward since August 2020 in its chart relative to SPY. In other words, this means that since August 2020, even though the price of Apple has gone up it has generally not outperformed the SPY.
This weekly relative chart between Apple and SPY shows that Apple may be attempting a breakout relative to SPY. Even though Apple's charts look somewhat weak on the higher timeframes (3M, 6M, 12M), this chart may suggest that Apple will at least attempt a breakout in its performance relative to the SPY. The weekly candle closed above the resistance line, and the Stochastic RSI oscillator is showing strong upward momentum on the weekly timeframe. Additionally, the weekly exponential moving average (EMA) is creating an ascending triangle pattern with the resistance line (not shown on chart). In 75% of cases, an ascending triangle is a continuation pattern, which in the context of Apple would mean a bullish breakout.
It's important to realize that relative price charts like this do not necessarily predict price action. In other words, since this is a relative chart, Apple may break out in this chart, and yet its price actually falls. This can happen if the SPY is falling faster than Apple. The best time to use this kind of chart, therefore, is when you think the SPY has made a significant bottom and will rise. Rather than investing in the SPY as its price rebounds, why not amplify your returns by investing in an asset that is likely to outperform the SPY?
Some consider this a "seeking Alpha" approach. Alpha is a term used in investing to describe an investment strategy's ability to beat the market. Strategies that are able to generate greater alpha (or return relative to the market), without introducing greater risk to your portfolio will increase your Sharpe Ratio. In this case, Apple is slightly more volatile than SPY and therefore introduces slightly more risk than owning SPY. One can mitigate this by analyzing all of one's portfolio holdings relative to SPY and selling an underperforming asset that is also more volatile than SPY and then purchasing an asset, (like Apple), that is likely to outperform SPY and which is equally or less volatile than the sold asset.
For example, compare the below charts of T-Mobile US (TMUS) and Verizon (VZ). Both charts are quarterly charts (3-month charts) and are relative to SPY. Relative price action for the past 10 years is shown. (Neither chart is adjusted for dividends). Although TMUS is slightly more volatile, it is generally in line with VZ. If given the choice between the two, which would you rather add to your portfolio?
T-Mobile US (TMUS) trending toward infinity relative to SPY:
Verizon (VZ) trending toward zero relative to SPY:
Not investment advice.

Apple Analysis 03.01.2023Hello Traders,
welcome to this free and educational analysis.
I am going to explain where I think this asset is going to go over the next few days and weeks and where I would look for trading opportunities.
If you have any questions or suggestions which asset I should analyse tomorrow, please leave a comment below.
I will personally reply to every single comment!
If you enjoyed this analysis, I would definitely appreciate it, if you smash that like button and maybe consider following my channel.
Thank you for watching and I will see you tomorrow!
You can also check out my previous analysis:
