AAPL Weekly AnalysisDrawing this curved channel we can see consistent rejections along the top (red) line, price has recently hit this line and been rejected
There are two options now for price recovery, at the yellow line, which is a trend established from previous price points
Or the 200MA (in green) which has conversely seen a lot of support touches
The 200MA entry is a more reliable choice in my pov
The breakdown is a result of a rising wedge pattern
Appleinc

Apple falling far from the tree? Apple - Short Term - We look to Sell at 154.48 (stop at 160.14)
We look to sell rallies. Posted a Double Top formation. The bias is still for lower levels and we look for any gains to be limited. Intraday rallies continue to attract sellers and there is no clear indication that this sequence for trading is coming to an end.
Our profit targets will be 138.36 and 130.14
Resistance: 155.00 / 170.00 / 182.00
Support: 140.00 / 130.00 / 120.00
Disclaimer – Saxo Bank Group. Please be reminded – you alone are responsible for your trading – both gains and losses. There is a very high degree of risk involved in trading. The technical analysis, like any and all indicators, strategies, columns, articles and other features accessible on/though this site (including those from Signal Centre) are for informational purposes only and should not be construed as investment advice by you. Such technical analysis are believed to be obtained from sources believed to be reliable, but not warrant their respective completeness or accuracy, or warrant any results from the use of the information. Your use of the technical analysis, as would also your use of any and all mentioned indicators, strategies, columns, articles and all other features, is entirely at your own risk and it is your sole responsibility to evaluate the accuracy, completeness and usefulness (including suitability) of the information. You should assess the risk of any trade with your financial adviser and make your own independent decision(s) regarding any tradable products which may be the subject matter of the technical analysis or any of the said indicators, strategies, columns, articles and all other features.
Please also be reminded that if despite the above, any of the said technical analysis (or any of the said indicators, strategies, columns, articles and other features accessible on/through this site) is found to be advisory or a recommendation; and not merely informational in nature, the same is in any event provided with the intention of being for general circulation and availability only. As such it is not intended to and does not form part of any offer or recommendation directed at you specifically, or have any regard to the investment objectives, financial situation or needs of yourself or any other specific person. Before committing to a trade or investment therefore, please seek advice from a financial or other professional adviser regarding the suitability of the product for you and (where available) read the relevant product offer/description documents, including the risk disclosures. If you do not wish to seek such financial advice, please still exercise your mind and consider carefully whether the product is suitable for you because you alone remain responsible for your trading – both gains and losses.


AAPL trading setup idea! 💡AAPL trading setup idea! 💡
Enter the trade by checking yourself. 💥
Do not put more than 2% of your capital at risk! ❌

AAPL is Going Down For Few Days!AAPL is going down for few days before it continues its bullish move, but it might break the last selected support + 0% Fibonacci zone to go even more bearish and that's because NASDAQ 100 is going to stay bearish with still for a week or so which supports even more the breakout of the support zone too, but we're not going to predict the market, and let's just sit and see what the price will do after that.
I'm short for today on NASDAQ:AAPL

Apple Short ScenarioNASDAQ:AAPL Signal
Entry - $154
Target - $103
Invalidation - $180
Risk to reward ratio - 1.9
Technical confirmations
RSI divergence showing the weakness.
Price formed a lower high since All Time High.
If the price breaks the upward channel and support then it should continue dropping to 0.618 Fib zone.
Fundamental confirmations
Why should price reach Target level?
82.5% shares being held by institutions and Top 5 institutional investors share volume change in the past reporting date is -6.5%.
Cash of company increased due to a debt, but financing and investing sectors of a company fell a lot during Q1 22.
Estimated earning of 2022 1.43 (0.7 lower than 2021).
China COVID lockdown increase delay of Apple product shipments.

Apple BearRising Wedge + Macro Bearish Divergence = RIP
Low ROI is not worth it anyway...
The only way bullish is if macro conditions improve and the melt-up rally commences (entails confirmed breakout)!

Apple 🍎 Some bad days for apple on the way marubuzu appring on privious day and macd indicating fall in stock
😞:(

Short AAPL Price expected to hit 150.61 Apple Inc has had a devastating hit with low sales they are working 24/7 to become a digital asset holder for entertainment now long term its a great buy. But in the next days we will see huge price drops. Buy LOW SELL HIGH.

Apple going bearishAfter its 11 degree bullish momentum, Apples has entered a consolidation since last year and with the current Russian-Ukraine conflict not helping, it may finally begin its bearish trend.

AAPL ShortHey traders, in today's trading session we are monitoring Apple stock for a selling opportunity around 175 zone, once we will receive any bearish confirmation the trade will be executed.
Trade safe, Joe.

APPLE STOCK ANALYSIS MEDIUM TERMHEY GUYS, I HOPE YOU'RE ALL DOING WELL.
this is my general outlook on the market i am currently bullish on the stocks market and looking to buy the dips as far as i can see a retracement is due in both indexes and some profit taking so that happens this is my plan of attack keep in mind that this is an idea a plan in a uncertain chaotic environment out of multiple plans to be cirtainedif anything happens that changes the fundamentals of this idea, i will update.
please note that this is not financial advice. do your own research and use this information as conformational biase on top of your own analysis.
like for support!!!!

APPLEHello dear, I hope so nice everyone today I have an Analysis from the apple chart I See this area of action because the price near-daily supply zone we want to price has a correction.
of course, apple is always bullish so we looking to buy for the long term.
good luck.

Apple - 2 long ideas - An Apple a day...General
After years of general rise in price i dont feel comfortable to buy stocks at this point and hope for a retrace. 2 Scenarios under which i would be happy to buy are marked in the chart.
1. Long (Orange arrow)
Requirements
- Price drops under level 1and retakes it
Target
Shortly under the $200 mark
Invalidation
- Price cant retake level 1
- Price falls again under level 1 after retaking it
Stop- Loss
- Slightly under the generated swing- low in the process of falling under level 1
Time duration
Days, weeks, months, years... ;)
2. Long (Green arrow)
Requirements
- Price drops and area 1 and retakes it
- Area 1 becomes support after retake
Target
S/R level at the recent swing high
Invalidation
- Price cant retake area 1 after dropping under it
Stop- Loss
- Under area 1
Time duration
Days, weeks, months, years... ;)
Good luck
Additional: I linked to 2 short scenarios aswell. I have no preferences - in best case i can take all four trades (2 shorts, 2 longs)

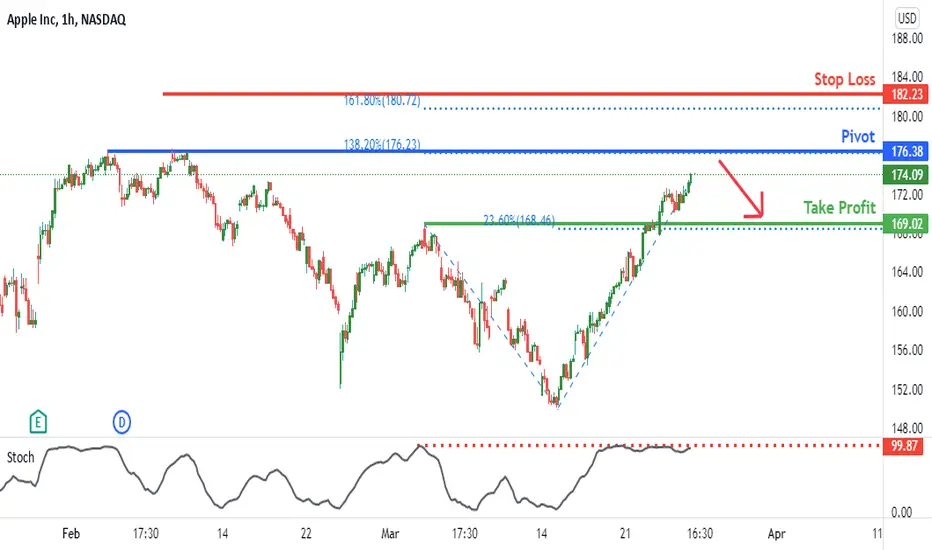
AAPL Potential for Bearish Reversal | 25th March 2022We are expecting for a bearish reversal from our pivot level at 176.38 in line with 138.2% Fibonacci extension towards our take profit level at 169.02 in line with 23.6% Fibonacci retracement . Our bearish bias is supported by the stochastic indicator where it is at resistance level . Alternatively, price might move towards stop loss level at 182.23 in line with 161.8% Fibonacci extension .
Any opinions, news, research, analyses, prices, other information, or links to third-party sites contained on this website are provided on an "as-is" basis, as general market commentary, and do not constitute investment advice. The market commentary has not been prepared in accordance with legal requirements designed to promote the independence of investment research, and it is therefore not subject to any prohibition on dealing ahead of dissemination. Although this commentary is not produced by an independent source, FXCM takes all sufficient steps to eliminate or prevent any conflicts of interest arising out of the production and dissemination of this communication. The employees of FXCM commit to acting in the clients' best interests and represent their views without misleading, deceiving, or otherwise impairing the clients' ability to make informed investment decisions. For more information about the FXCM's internal organizational and administrative arrangements for the prevention of conflicts, please refer to the Firms' Managing Conflicts Policy. Please ensure that you read and understand our Full Disclaimer and Liability provision concerning the foregoing Information, which can be accessed on the website.
$AAPL never actually closed below recent support. Bullish.Apple back above support and looking bullish, currently.

Apple at Trend Line? Apple - Short Term - We look to Sell at 165.65 (stop at 170.37)
We look to sell rallies. 50 1day EMA is at 164.00. Prices expected to stall near trend line resistance. The next barrier is the trend of daily lows at 150.00.
Our profit targets will be 150.18 and 141.15
Resistance: 165.00 / 170.00 / 182.00
Support: 150.00 / 140.00 / 135.00
Disclaimer – Saxo Bank Group. Please be reminded – you alone are responsible for your trading – both gains and losses. There is a very high degree of risk involved in trading. The technical analysis, like any and all indicators, strategies, columns, articles and other features accessible on/though this site (including those from Signal Centre) are for informational purposes only and should not be construed as investment advice by you. Such technical analysis are believed to be obtained from sources believed to be reliable, but not warrant their respective completeness or accuracy, or warrant any results from the use of the information. Your use of the technical analysis, as would also your use of any and all mentioned indicators, strategies, columns, articles and all other features, is entirely at your own risk and it is your sole responsibility to evaluate the accuracy, completeness and usefulness (including suitability) of the information. You should assess the risk of any trade with your financial adviser and make your own independent decision(s) regarding any tradable products which may be the subject matter of the technical analysis or any of the said indicators, strategies, columns, articles and all other features.
Please also be reminded that if despite the above, any of the said technical analysis (or any of the said indicators, strategies, columns, articles and other features accessible on/through this site) is found to be advisory or a recommendation; and not merely informational in nature, the same is in any event provided with the intention of being for general circulation and availability only. As such it is not intended to and does not form part of any offer or recommendation directed at you specifically, or have any regard to the investment objectives, financial situation or needs of yourself or any other specific person. Before committing to a trade or investment therefore, please seek advice from a financial or other professional adviser regarding the suitability of the product for you and (where available) read the relevant product offer/description documents, including the risk disclosures. If you do not wish to seek such financial advice, please still exercise your mind and consider carefully whether the product is suitable for you because you alone remain responsible for your trading – both gains and losses.

appl next weeki expect a pull back and an up trending in apple stocks,for whoever interested in short term

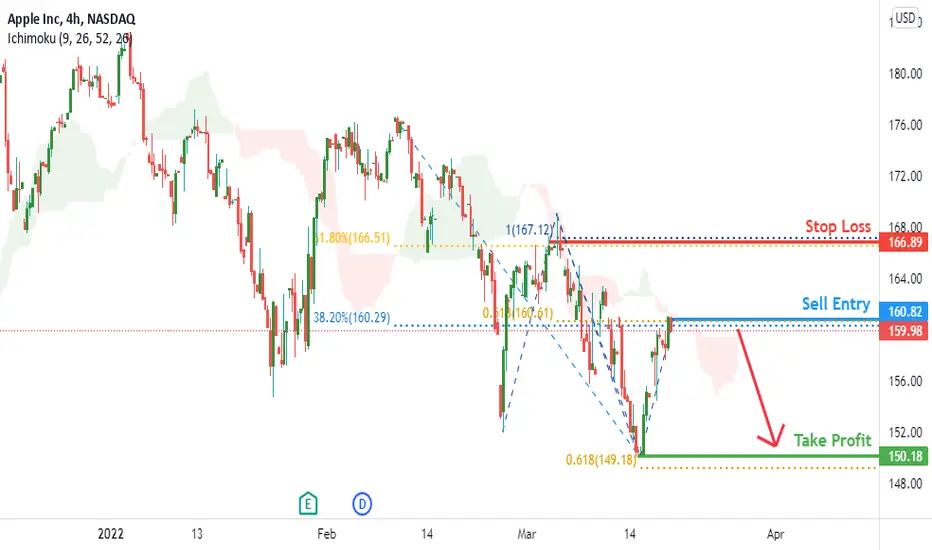
AAPL Potential for Bearish Dip | 18th March 2022We expect price to dip from our Sell Entry of 160.82 in line with the 38.2% Fibonacci retracement and 61.8% Fibonacci projection to our Take Profit level of 150.18 in line with 61.8% Fibonacci projection, along with the horizontal swing low support. Our bearish bias is supported by price trading under Ichimoku cloud indicator. Alternatively, price may break our entry structure and head for our stop loss of 166.89 in line with the 100% Fibonacci projection level and 61.8% Fibonacci retracement.
Any opinions, news, research, analyses, prices, other information, or links to third-party sites contained on this website are provided on an "as-is" basis, as general market commentary, and do not constitute investment advice. The market commentary has not been prepared in accordance with legal requirements designed to promote the independence of investment research, and it is therefore not subject to any prohibition on dealing ahead of dissemination. Although this commentary is not produced by an independent source, FXCM takes all sufficient steps to eliminate or prevent any conflicts of interest arising out of the production and dissemination of this communication. The employees of FXCM commit to acting in the clients' best interests and represent their views without misleading, deceiving, or otherwise impairing the clients' ability to make informed investment decisions. For more information about the FXCM's internal organizational and administrative arrangements for the prevention of conflicts, please refer to the Firms' Managing Conflicts Policy. Please ensure that you read and understand our Full Disclaimer and Liability provision concerning the foregoing Information, which can be accessed on the website.
AAPL exposure to Russia and ChinaThe U.S. warning China it could face devastating sanctions if it defies the ban on doing business with Russia!
This is a move that could have huge impact on American companies.
1.4% of Apple`s revenue comes from Russia, while 19% comes from China!
My price target for AAPL is $139.
Looking forward to read your opinion about this.

CRAPPLE A BIT SHORT IN ONE SIDE :DHello trenders,
Here my ridiculous and funny chart showing a dramatic STFS (short the fuc.in stock).
Necessity is the mother of the economic growth. Left for use to 1 billion people market only the IOS devices are not enough to pay creativity, especially with the raw material missing.
Solution... try to crucify tesla on battery cars or follow the Nokia route.
Good luck
The best short is the one you avoid.

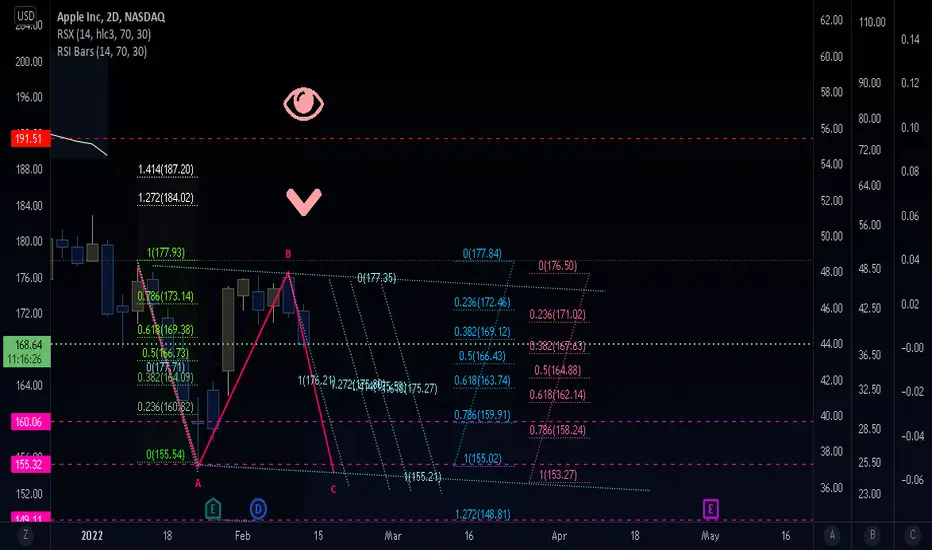
Apple is losing its sugar. AAPLImmediate targets 160, 155, 149. Invalidation 191.
We are not in the business of getting every prediction right, no one ever does and that is not the aim of the game. The Fibonacci targets are highlighted in purple with invalidation in red. Fibonacci goals, it is prudent to suggest, are nothing more than mere fractally evident and therefore statistically likely levels that the market will go to. Having said that, the market will always do what it wants and always has a mind of its own. Therefore, none of this is financial advice, so do your own research and rely only on your own analysis. Trading is a true one man sport. Good luck out there and stay safe