Apple - End of Wedge - Bullish or Bearish? Either Way Big BreakNASDAQ:AAPL
Apple is at the end of the wedge between several support and resistances. Watch on the lower intervals and wait for the break AND re test. I am thinking it may break down to $250-$260 at least.
Appleinc


Apple Full Trend Reversal W/ MA?NASDAQ:AAPL
Apple might be in the middle of a full on reversal from this massive drop it's been on for awhile now. Follow the 20/50/150/200 MA from 1 minute all the way up to 1 hour chart and notice how they are all reversing trend. The key now is to follow the 2H-4H today maybe more to see if they complete the reversal on the 50 passing over the 150 etc. Could be an amazing sign for Apple. If it gets stuck though the downside would be a big sell off. I think Apple is bullish and people want it to be bullish in the market so my hopes are directed that way. Also is was massively oversold since Feb.
Thoughts?
Do you due diligence as always and make sure to keep up to date with all the market news and pre market buzz concerning the overall market and virus.


Apple Options - 15m / 1m Failling WedgeI think you may see another Apple burst today for options. 1m which I cannot publish has a small falling wedge. 15 min seems to only back that up. Of course we are in odd times so anything can happen. Given pretty positive news past few days with agreements with NASDAQ:AAPL and NASDAQ:AMZN along with the cool new Apple feature "accidentally released" I think we should have positive movement. Once again... news outlook has some positives for the industry today especially energy sector, but unemployment etc is downside on the news.

Apple Falling Wedge on 15m - Options?Looks like Apple might be in a short term falling wedge. NASDAQ:AAPL
Trading options might be good

Apple At Dynamic Support (SMA 200)It's floating around the dynamic support (SMA 200) which can prolly hold price falling from further lower if overall market index showing positive sentiment. Stochastic supporting the bullish momentum. Knowing that China is open for business more than two months after imposing quarantines to counter the coronavirus, China is getting back to work. With new infections dwindling, factories are restarting, stores are reopening, and people are venturing outdoors. In some ways, China is where the U.S. and Europe hope to be within weeks or months.

Descending channel Apple - SHORTAs we saw with other stocks they joined in a pullback what will show again a drop to lower levels.
I'm short in apple same as NIKE.

Apple Inc (AAPL) long.All description on the chart.
Please, don't forget to like and follow.
Thank you.

AAPL - Apple Inc. Analysis Given the market situation in this period I see this stock short.
Since it has a very high market capitalization, when it goes down it will also drag the index itself. I think it's a good time to go short when MACD and Stochastic converge on the signal. At the moment I see an accumulation phase with a small rise in the next few days to take some stop loss, so probably bull trap.
My analysis is due to the fact that the turnover will also drop because now people more than buying products surely have other primary goals.
THIS IS NOT AN INCENTIVE FOR FINANCIAL INVESTMENT. MY TECHNICAL/FUNDAMENTAL ANALYSES ARE SIMPLE MARKET CONSIDERATIONS.
Comment on your ideas, follow me for further analysis.
Thanks!

AMZN Bullish comeback Bearish gold market last week at same Time that media has been talking about the major drop in stock market, something is telling me investors might be coming in to buy big again for a lot of stocks, might also see more downside for gold.
TP and SL have been marked on chart.

AUDJPY Market Overview & Possible Trade PlansChecking out AUD/JPY today as the pair recovers from an early Tuesday drop, likely on rising global risk aversion sentiment as coronavirus fears blaze up once again. Words are in town that by Apple, who issued revenue guidance warning www.theverge.com overnight, evoking fears of a more significant impact from the coronavirus outbreak on the global economy.
This lead to a break of the rising trendline lower lows on the hourly chart, as seen above, but the bulls stepped in to halt the decline around the pivot weekly s1. The pair is now testing the past broken strong support area around 73.50, which could draw in sellers looking for another opportunity to play the risk-off sentiment at a better price.
Be on the look out for bearish reversal patterns before considering a short play, and if the upcoming Australian data disappoints, then this pair could make a run for fresh break of today’s swing lows.
For the bulls, a turn in Coronavirus sentiment could halt the decline, as well as a big positive surprise from Australia’s upcoming leading and wages data. A break above 73.50 in the scenario could draw further fresh buyers who could shoot for the 74.00 handle, which is well with reach knowing the ATR of around 60 pips for this cross pair.

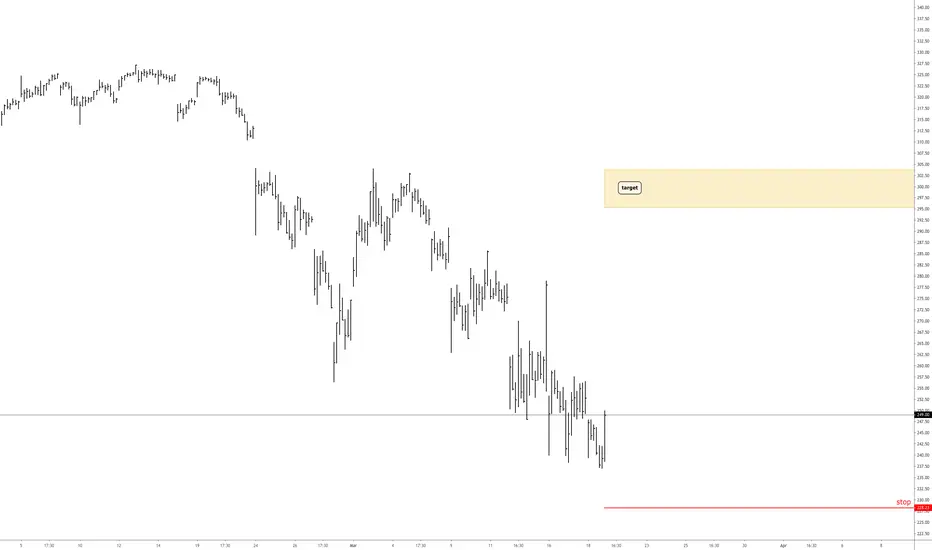
APPLE LOW RISK SHORT SETUP BUILDINGI really hate to trade countertrend moves but apple gave a really good setup for shorts, also it is not bad for apple to correct from this levels for a couple of weeks
White lines are my short trigger and stop points, i am also expecting another leg up, and if it does i will be stopped out and try another short depending on a daily candle breakdown. My rule is do not try more than 3 times
Let's see if it makes a nice profit or a small loss
Trade safe

AAPL Lower Volume RunAAPL had a steady decline in volume as it ran up to test the recent new all-time high. This may create a short-term sideways price action until more volume buyers or High Frequency Trader action triggers more volume to the upside.

Apple Inc - APPLE Possible short term trend reversal Divergence says trend should reverse at least for a short time, but trend is also accompanied by a strong support levels. It's too risky at this time for both short or long entries. Wait until it drops to the mentioned Fibonacci levels and decide whether it will reverse or continue.

What does BTC fractal say about AAPL ? Do not FOMO !Hello everyone,
As lot of people talks about stocks like Apple these days I´ve decided to take a look at it and here is what I see and think about current APPL trend.
Anyone who invested in crypto or trade cryptocurrencies knows it is stocks boosted x10 so thats why I used (for easier comparison)
Weekly & MA200 for APPL
Daily & MA100 for BTC
This might not be the exact "TOP" for APPL but anyone buying here for long term investment might get burned pretty well.
Apple might bring nice trading opportunities very soon so keep your eyes opened.
I think no extra explanation is needed here or is it ?!
Feel free to leave a comment or questions below the chart.
Cheers
-------------
Disclaimer:
I´m not registered or licensed in any jurisdiction whatsoever to provide investing advice or anything of an advisory or consultancy nature, and therefore I´m unqualified to give investment recommendations.
Always do your own research and consult with a licensed investment professional before investing.
This communication is never to be used as the basis of making investment decisions, and it is for entertainment purposes only.

AAPL W FormationW formation, this is from my experience a bullish formation. It seems a parabolic run is underway currently.

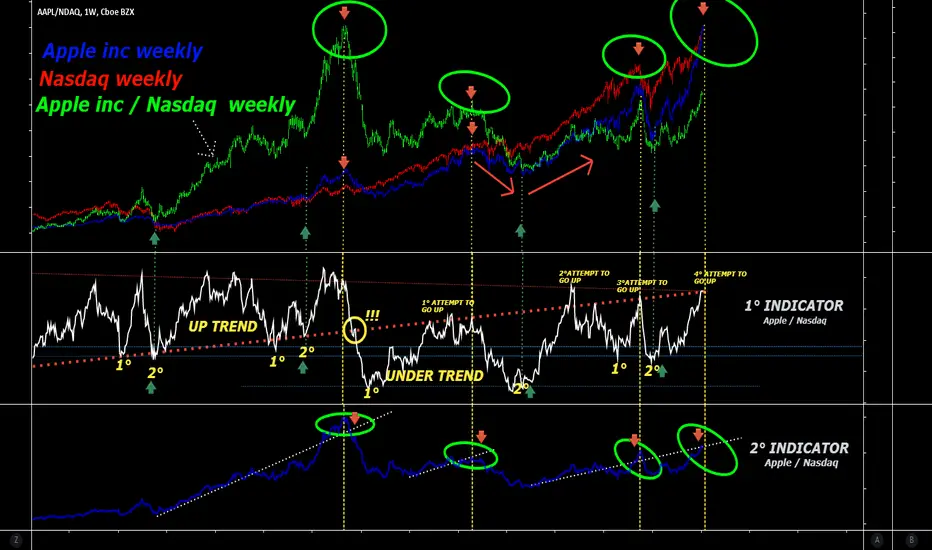
Apple inc / Nasdaq It is very difficult to study Apple inc, the apple nasdaq ratio allows us to see some things: 1 ° the correlation between the ratio and apple inc and the nasdaq, the 1st indicator gives us some information, the most important is that now it is under the trend, the second is that it has tried 3 times to go up and now we are in the fourth, the second indicator finds the reverse short points
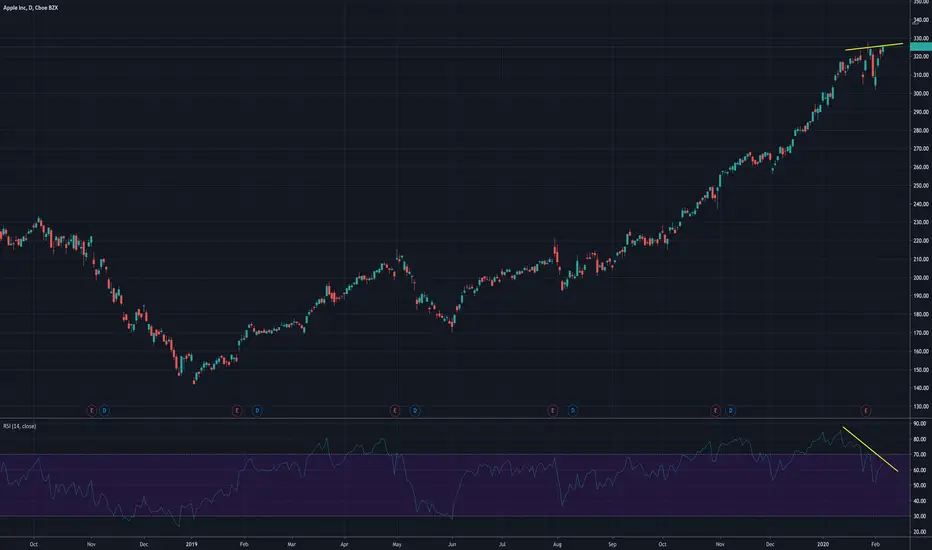
AAPL in a bubble?Angle is building up over the years. Apple and many other stocks are looking very overextended. I'm not trying to predict the top here it is extremely difficult. But this won't last forever. Mania Phase will end with a very harsh correction..

AAPL Dark Pool DistributionAAPL has reached new highs recently, moving up due to new investors buying fractional shares of this stock. However, Dark Pools are selling large lots as AAPL moves up. If the fractional investors stop buying, the sell side pressure will increase at least temporarily.

Apple Stock Is Up 85%+ Over the Past YearWelcome to PrimeXBT ’s technical analysis of one of the stock price of one of the largest technology companies in the world: Apple.
Fundamental Analysis and News:
After the 2018 Christmas Eve collapse of U.S. equity markets, 2019 was a year that proved many forecasters wrong. The economy remained strong, markets soared, and stocks continued their decade-long expansion.
This happened despite multiple warnings from analysts of an impending recession after the yield curve inverted over the summer, producing one of the biggest signals that growth was about to turn negative.
Demand for Apple Inc. AAPL, +1.00%: iPhone sales are poised to skyrocket thanks to new 5G devices, according to Wedbush analysts, who raised their price target to $350 from $325 and maintained its outperform stock rating in a Monday note.
Apple faced several challenges at the start of 2019, including smartphone competition, diminished demand in China, and a lack of 5G innovation.
Technical Analysis:
Apple Inc. holds buy signals from both short and long-term moving averages. Some negative signals were issued as well, and these may have some influence on near-term development.
A sales signal was issued from a pivot top point on Tuesday, December 17, 2019, which indicates further losses could be imminent until a new bottom pivot has been found. Volume rose on falling prices yesterday. This may be an early warning and the stock’s price action should be followed closely.
On downwards corrections, there will be some support that’s coming from uptrend line and 1.272% Fibonacci — which is one of its major support levels. It will be the fourth correction wave of the Elliott 12345.
Several short-term signals, along with a general uptrend, are positive and we conclude that the current level may be a good buying opportunity, as there is a fair chance for this stock to perform well in the short-term.
Resistance Zone: $280 - 290
Support Level: $260
Psychological Resistance Level: $300
Market Cap: 1260.645 B
Watch closely for our future updates to be the first to get well-timed trading signals!
We hope you have great success with all your next trades.
