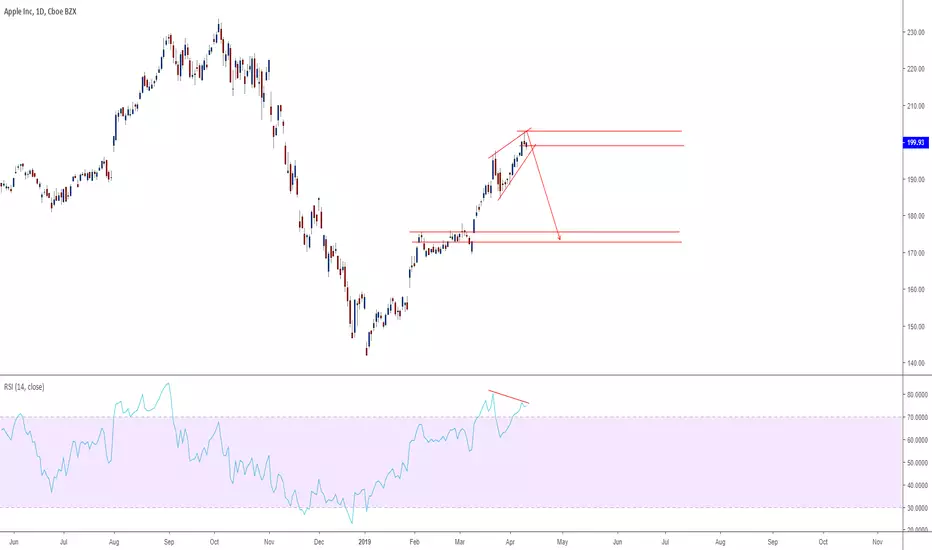
Apple Inc (AAPL) Is Already Falling, Crash Ahead! (UK)Apple Inc (AAPL) is already falling and is now trading below EMA10, after breaking it with high volume.
In 2019 AAPL felt below EMA10 twice only to quickly bounce and continue with its uptrend, so what's the difference now?
The first time this happened was back on the 24th January, the second time on the 7th March, each time volume wasn't strong enough. The break we see today below EMA10 is supported by big volume which means that AAPL can continue falling.
On top of the high volume break of EMA10, we also have a very strong and nasty bearish divergence as a well as a rising wedge pattern (purple line).
All of the above signals are telling us that Apple Inc can go lower, in fact, if it breaks below EMA100 (blue line), AAPL is very likely to break below the low that was hit on the 3rd Jan.
Conditions for change: If AAPL breaks above EMA10, some of these signals become invalid. If AAPL breaks above 208.29 with good strength and volume, then the entire analysis above becomes invalidated and a new one is needed. For now, AAPL is bearish and going down.
This is not financial advice. All information here is shared for entertainment and educational purpose only, trade at your own risk.
And remember to hit like of course... If you want to.
Namaste.
Appleinc

Apple Inc (AAPL) Is Already Falling, Crash Ahead!Apple Inc (AAPL) is already falling and is now trading below EMA10, after breaking it with high volume.
In 2019 AAPL felt below EMA10 twice only to quickly bounce and continue with its uptrend, so what's the difference now?
The first time this happened was back on the 24th January, the second time on the 7th March, each time volume wasn't strong enough. The break we see today below EMA10 is supported by big volume which means that AAPL can continue falling.
On top of the high volume break of EMA10, we also have a very strong and nasty bearish divergence as a well as a rising wedge pattern (purple line).
All of the above signals are telling us that Apple Inc can go lower, in fact, if it breaks below EMA100 (blue line), AAPL is very likely to break below the low that was hit on the 3rd Jan.
Conditions for change: If AAPL breaks above EMA10, some of these signals become invalid. If AAPL breaks above 208.29 with good strength and volume, then the entire analysis above becomes invalidated and a new one is needed. For now, AAPL is bearish and going down.
This is not financial advice. All information here is shared for entertainment and educational purpose only, trade at your own risk.
And remember to hit like of course... If you want to.
Namaste.

APPLE: Still bullish, aiming for another Gap upwards.AAPL has been on a very strong rise since the early January bottom, trading within a steady 1W Channel Up (RSI = 61.638, MACD = 3.680, Highs/Lows = 11.9657) with clear Higher Lows (entries) and Higher Highs (exits).
Every Gap of the late 2018 correction appears to be a target for this Channel Up, which later is turned into a Support. In that sense the current Support Zone (buy entry) is 196.23 - 198.85 and Target Zone is 213.25 - 217.45.
** If you like our free content follow our profile (www.tradingview.com) to get more daily ideas. **
Comments and likes are greatly appreciated.

Apple, long to new accumulation zone 216 - 220.Ok, today i will analize Apple on Nasdaq. There is strong upper trend after big sells under 199. This position is confirmed by volumetric analysis using x-volume indicator. Like show x-lines on day timeframe there is strong level 209. And i think be better to sell some part of long position there. Next we have accumulation zone 216-220 which is represented whith 3 strong levels. And i think in medium term price will go up to this zone. So its clear long)
Levels thanks to X-lines indicator.


ShortA great high probability short term setup on AAPL. The ending diagonal with divergence marks the end of A-B-C correction or alt 5 wave impulse.

APPLE INCHere we have the following reasons for selling :
- RSI Divergence
- 5 waves completed
- Correction Due
Here what we have is an incomplete pattern, so we wait for the support to be broken out which is preferrably around or below 198/197.00 zone then we sell
To Minimize Risk For Apple (in Rising Wedge Pattern)Look at these trend lines.
The stock value of the apple has grown exponentially within a certain trend.
Looking at these trends, we can say that currently buying apple stocks has a moderate risk.
In order to reduce the risk, it is better to wait between 150 and 180 for the purchase levels.

APPLE What happens when the bubble bursts?I am not some end-of-world theorist, I am just applying Jean-Paul Rodrigue's Stages of a Bubble of the Apple Inc stock.
I do believe that the current price correction is not over, as the MMAR shows that since 2008/09 each correction has been longer than the previous one. And currently Apple isn't even halfway through.
But if we apply the Stages of a Bubble theory we see that after the Hyperwave (parabolic rise) was completed in 2018, Apple is current on Phase 6. Despite the big technical Resistance forces, this is also the psychological stage where investors believe that the price "returns to normal". What theoretically happens next is a super strong sell-off (Phase 7) where the asset "returns to the mean". A -80% correction from the top puts Apple's stock roughly at $47.
I have to state again the obvious that it is too early to consider this price scenario plausible but since I believe that the current correction phase will last longer, I do expect the 2019 low to be revisited ($142.00).

Elliott Wave View: Apple Looking for more UpsideAfter topping at $233.47 on October 3, 2018, Apple (APPL) dropped to $142.9 for a staggering 39% decline only within 3 months. From $142 low on January 4th, 2019, the stock has rallied and retraced 50% of the drop at $187.9. We think the decline from $233.47 to $142.9 only ended the first leg wave a. The rally from January 4 low thus is within wave b correction with subdivision as a zigzag Elliott Wave structure.
In the short term chart, we can see that wave (1) ended at 189.26 peak and the internal structure unfolded as an Elliott Wave impulse. Below from there it pulled back to $184.73 and ended wave (2) as an Elliott Wave double structure. Above from there, it made again a new high confirming the next possible extension higher towards 203.06+ areas which is the 4H equal legs of the ZigZag structure. As long as pullback stays above 184.73 it is expected to extend higher.

Potential -%35 Drop APPL R/R:10 ST1Top of Wedge's Channel,
Sell The News.
P.S.:This is my first Stock chart. Please don't take this as financial advise.

RECESSION is coming, run for the APPLE trees.Price is currently at strong resistance, we can only see a bearish move possible to our red resistance zone in the next few weeks.
This is due to the state of the US economy and the weakening strength of the stock market, the stock markets are in a bearish mood this week and this is because people are starting too get scared and realise what a mess Trump is causing.
A recession is just around the corner and when people have no money they cant spend it on fancy gadgets, the only apples they will be buying are the ones that grow on trees ;p

APPLE INC. EW Analysis.Catch the dip @ 38.2%/50%/61.8% retracement points.
261.8% target remains a possibility but seems less likely for bullish target, 425% seems more likely.
Goodluck

AAPL I think apple will go up by a lot.I think apple will go up a lot, but even if it doesn't, the RISK TO REWARD is very good.
frankly I don't see price, I see risk reward and money.

APPLE bounceApple has made a sharp drop (about 40% in 90 days).
It has bounced on the MA 200 (weekly), a very important support.
Now the bounce seems to be in progress.
The 160 dollar could be broken and if this happens the continuation to 175 is very likely.
We could see the 78.6% as a bullish as a bullish confirmation.

WHY I BOUGHT APPLE STOCKS WITHOUT OWNING ANY APPLE PRODUCTS1. Price action has shown a bounce off good weekly structure support.
2. 0.618 FIBB levels aligns with structure as well.
3. 200 Day moving averages on the weekly aligns as well with structure.
4. Good risk reward
5. RSI Bullish divergence on daily chart and oversold conditions.
* The high confluence of indicators and price actions gives us enough confidence for a swing trade for apple stock. Cheers do let me know what you think!
Check out the youtube: youtu.be


Apple (AAPL) Has Probably Plateaued I'm doing this main chart using the log scale because it makes it so obvious that growth is slowing down. We just got rejected hard off the resistance that has held us since the 80's! We're also in a giant rising wedge, and are JUST touching the bottom of it right at this very moment (actually, I'm being generous with my line. In truth, we've broken down already). Now, I don't think Apple will disappear. That's not what this analysis is about. As I've mentioned recently, I think many tech stocks have plateaued. Some may continue higher eventually, but Apple most likely will not grow much. Why? I think the world's population has peaked, and people's interest in technology has also peaked. People who speculated on Apple have also walked out with massive profits. Just look at that graph! In my opinion, and I know it's controversial, there is no reason for Apple to continue to grow at an astronomical rate. As you can see, growth has clearly reached a point that it cannot sustain and it will likely flatline, or experience a long period of slow growth. Their tech has simply become a part of our daily lives. It's almost part of our biology at this point. Why speculate on it anymore? I argue that by becoming so valuable, it has actually set the stage for its own demise. I don't know if this makes any sense to you. By demise I mean stagnation, basically.
Anyway, where Apple flatlines is anyone's guess. We have some possibilities on this chart (green zones). It could be fairly near current prices (in the $80-100 area). Or it could be in the $50 zone. That seems more likely to me, given the size of the tech bubble.
I think people will continue to use Apple products every day, so I don't see it really falling off a cliff permanently. It's also dropped pretty substantially from it's all-time-high already. As I mentioned in my DJI analysis, I was pretty sure it would not be able to sustain above the $1 Trillion market cap. I was surprised that it held up there as long as it did, to be honest. A lot of people out there will keep on harping about investing and how everyone should still hold Apple stock in their portfolio. I do not think there is much upside anymore. It might EVENTUALLY gain back a good amount of what it's lost since the ATH, but I doubt it'll reach beyond $1 Trillion again. This is just my view, though. I could be totally wrong. I just have a feeling about it though.
I am not a professional financial advisor, and this is not financial advice.
-Victor Cobra

apple, dead cat bouncethese gaps are always filled before the market finds its direction. decent dead cat bounce incoming


AAPL (APPLE) Following Interesting Long-Term Channel!!IG: @BULLRINGANALYSIS
Easy to say/noted that AAPL has been following an upward trend & triangle pattern for some time now. The beginning of 2019 will be interesting for apple to say the least after massive drop in late 2018. Despite the drop, Apple has MUCH room for growth.
P.S : RSI Levels in good position for upward movement
not financial advice

APPLE's falling from the treeAPPLEs falling from the tree, but it is not a season for gathering them yet
*************************************
THIS IS NOT A TRADING ADVICE
*************************************

Apple swingIn the four latest setbacks we have seen a turn between fib 0.5 and 0.618 (2013 was just below 0.5).
Support area 150.
Target 180.
Possibly a good swing coming weeks.
