Apple looks juicyRight over 50EMA/DMA, hovering around 0.618 FIB level and at the bottom of the channel + killer earnings.
Looks like a buy around 128-130.
Applelong

APPL Falls after Earnings. Here is the Recovery.Lets get to this bag.
APPL falls from all time price of 145 after the release of a "great" earnings report.
I consider myself a swing trader and typically hold option positions anywhere from 1 to 60 days max.
Most of my option plays have an expiration date of no less then 30 days from the time open the position.
I want to draw your attention to the yellow highlighted circles on the chart. Circle 1 indicates the support forming between the prices of 126 and 129. I expect price to come down to test these areas and bounce off the upward "black" trendline as my first signal of a buy confirmation.
In the event that the "black" trendline has been compromised and does not hold the "blue" Support line has been tested several times this month and respectively held its own in support. A bounce off of the "blue" support line acts as my 2nd signal of a buy confirmation.
As the 3rd signal of a buy confirmation see the highlighted yellow circle towards the bottom. This is the RSI indicator. It is clearly in the oversold area which means this could be a text book buy. I don't necessarily see any divergence between the price and the RSI which would of been a strong 4th confirmation.
If these support levels hold strong i see APPL going back up to test the 145 all time high sometime during late February.
If you like this analysis please like and follow. This will encourage me to do more.
Good luck trading.

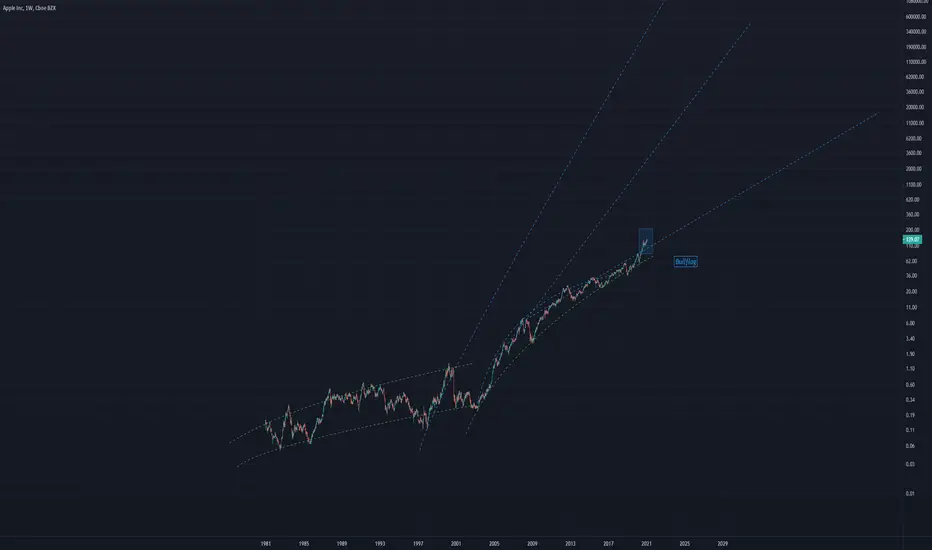
APPLE LongApple showing signs of a bullflag
this is the weekly chart so going long would be necessary
very bullish

Apple Trade Did Not Let Us DownEverything went smoothly according to the plan. Hope some of you took advantage!

US Stock In Play: $AAPL (Apple Inc)$AAPL have successfully exhibited a clean break of its 3 months consolidated Symmetrical Triangle chart pattern that was highlighted previously on 25th November. The breakout have $AAPL rallying +16.62% in 20 trading session, attaining its first profit target at all time high resistance point of $138.70 level.
At the current junction, $AAPL’s attempted breakout of its all time high price level is resisted with insignificant volume. With 20D MA acting as a minor short term support that have been holding up the breakout rally of $AAPL, the momentum on $AAPL remains bullish on short term.


$AAPL APPLE target price @$187.96 +38%Apple has activated a second impulse with target price at $187.96 that is +38% from current price.

Retest of Apple highs soon?With the recent breakout I believe we may see a breakout that could push us towards the previous highs, my timeline would be January - February.


AAPL Long All time highAAPL has strong support at 123, if it bounces back from 123, new resistance at 131 and around earning chance of hitting all time high.

Apple Trend Continuation?Lately, tech stocks have seen lots of sideways price action over the last few weeks. The Apple chart looks to have formed a symmetrical triangle on top of the weekly 21EMA with hidden bullish divergence on the RSI. A daily close above the $121 resistance level could trigger a move towards the $125 weekly resistance. A weekly close above $125 may push prices back to the $137 high or the R4 yearly pivot.

Apple stocks buy if you want to buy carHello traders!
I am Noah a professional trader with a 5 years of experience.
Hey guyz i Analyzed Apple stock today and i think its a great chance to buy don't miss this opportunity otherwise you will regret🔥

APPlE - buying iphone 12
Shares are growing.
On the eve of winter vacations.
Many will use the apple applications.
Buy and buy many applications)
And the action will grow in price and price.
You will learn the best place where we can trade this instrument at low risk.
Write in the comments all your questions and instruments analysis of which you want to see.
Friends, push the like button, write a comment, and share with your mates - that would be the best THANK YOU.
P.S. I personally will open entry if the price will show it according to my strategy.
Always make your analysis before a trade


APPLE idea Apple is about to break the resistance level, but before that, it will return to reach the trend line. Wait until the market breaks the resistance level, then you can place a buy order.
- If Apple goes beyond the trend line, then wait for another buying opportunity because this idea is no longer valid.

AAPL All Time High ?After Breaking out the triangle in my point of view the stock is completing the pullback and the orange downside trend is our pullback zone after that we can have a safe buy trade to target of the ATH (All Time High) with stop loss a bit lower of our red uptrend

Apple - Measured MoveHello Everyone,
If it breaks the wedge, then the target would be the measured move from 123 + 22 = 145 would be its next target. RSI is moving downward so I think it will come back down for another round and then breaks the Wedge. Watch price movements! 123,121 and 115.

Apple - became the BLACK SHEEP of the tech stocksSo, let’s say it all out loud - from wall Street tech dearest to the black sheep....
Apple Q4 earnings broke record high on Mac sales / iPad sales / Services but didn’t bring in the numbers on iPhone sales ... ok so ? this stock used to be the most valuable stock for the street and now because of high expectations its being looked at under a microscope.
LET’S TALK TECHNICAL:
so support level since stock split is obviously 110 as you an see it gave us 2 fake outs and went back in line , today would be considered the third fake out but all and all the support is holding fairly well.
Resistance is currently at 125 but as it seems it haven’t been tested enough to be established as a strong resistance.
Stochastic is under the 25 line - oversold.
the volume displayed at the last couple of days shows us its mostly institutional volume and not retail traders losing faith in the stock or company - institutional sell offs are not rare and must be identified, so we the retail traders will understand the source of the drop .
the market cycle - ABCD we are seeing is yet to be completed and in the MCBA ( market cycle based analysis ) that we use in FDGT foretells us that the next move seems to be a completion of the cycle and it is a rising one all the way to 135$ if resistance will not hold which seems at the moment it won’t.
let’s add to that the fundamental side:
- the stock is valued at 135$ - 140$ by the firms in the "street", so the pressure for it to rise is only getting bigger ! along with the bottom line that the Q4 earnings were successful and the services income doubled from previous quarter - services profits are much more meaningful then providing goods as their cost to the company is far less costly .
combining all these factors and the technical indicators we have, Apple for me is a STRONG BUY! no questions asked.
Target price is 135$
This is not an investment advice of any sort but our own personal opinion
Trade safe!

US Stock In Play: $AAPL (Apple Inc)$AAPL is currently exhibiting the same symmetrical triangle pattern as $TSLA which has already broken out, and cleared its all time high.

APPLE Breakout with MA 200 crossingAPPLE broke the triangle pattern with low volume, so a retest s possible to coonfirm the breakout.
The target is between 130-140 Euro.
Stoploss at 93.5 Euro.
Buy now or set Orders at 97 Euro.

