Apple | Fundamental Analysis | Must Read...Apple will release its fourth-quarter 2021 fiscal year results this Thursday, which entails investors looking for a fast-growing stock trading at a low price need to act quickly, as the smartphone titan looks poised to deliver solid numbers that will help halt the recent decline in its stock price.
As many know, Apple's stock has fallen over the past few weeks notwithstanding reports that the latest iPhone 13 models are in greater demand than last year's lineup. Let's take a look at the reasons why smart investors should take advantage of the Apple stock pullback.
Recent reports suggest that iPhone 13 sales may be held back by supply chain constraints. The iPhone maker could lose as many as 10 million iPhone 13 units as a worldwide shortage of semiconductors could disrupt production lines. The smartphone maker reportedly expected to produce 90 million iPhone units in 2021, but third-party reports indicate that it may fall short of that mark.
As it turns out, the chip shortage is awaited to influence not only iPhone production, but also interfere with the release of iPads and MacBooks. Not surprisingly, investor sentiment towards Apple stock has turned negative, but it should not be forgotten that the company has a huge opportunity.
For example, Wall Street expects Apple's fourth-quarter revenue to grow nearly 31% year-over-year to $84.7 billion. Earnings are expected to rise to $1.23 per share from $0.73 per share a year ago. When the company released its fiscal third-quarter results in July, Apple did not provide official guidance, citing uncertainty caused by the COVID-19 outbreak, but it would not be shocking if the company beat market expectations.
Morgan Stanley analysts estimate that Apple's iPhone shipments for the quarter that ended in September will grow 17% year over year to 49 million units. When you consider that in the 5G era, Apple expects the average selling price of iPhones to rise significantly, revenue from the company's largest product line (which accounts for 49% of third-quarter revenue) could grow impressingly. Not surprisingly, Morgan Stanley analysts expect Apple's iPhone revenue to grow 52% year over year in the September quarter.
The higher ASP, as well as the fact that the company's services business is growing at a good pace, should lead to higher margins. Apple recorded a 33% year-over-year increase in services revenue in its third fiscal quarter, and that trend is likely to continue, due to remarkable increase in offerings such as the Apple TV+.
All of this indicates that Apple is well on its way to achieving good results. More importantly, the tech giant will likely be able to maintain its high growth rate as it is at the beginning of a big renewal cycle.
Investors shouldn't worry too much about near-term problems that could derail iPhone production, as the company has ample room to grow in the era of 5G smartphones thanks to its huge user base.
CEO Tim Cook said in January that Apple has a base of more than 1 billion active iPhone users. The company only released its first 5G-enabled iPhone models last year, which means that only a small fraction of its installed base is using 5G devices. Shipments of the iPhone 12 (Apple's first 5G-enabled device) totaled 100 million units this April, meaning that millions of users are still in the upgrade window.
Thus, Apple could continue to see significant growth in shipments in the coming years as more and more users upgrade to the new iPhones. Add to that improved pricing for 5G-enabled smartphones, and it's no wonder why Apple's revenue is expected to grow nearly 20 percent a year over the next five years. That's a big jump from the 8.4 percent annual earnings growth the company has seen over the past five years.
Finally, since Apple is trading at a forward earnings ratio of 29, which is lower than the Nasdaq-100's high tech weighted ratio of more than 35, it makes sense to buy these tech stocks before the earnings report comes out, as strong numbers and solid guidance can lift the stock and increase its value.
Applestock

Ready for Apple drop?Reversal strategy in place to lower share price as a retracement of the weekly structure. LTF confirmation advised.

Buy Apple (AAPL) 14/10/2021You can buy Apple (AAPL) target 157.23 stop loss 137.56
Money management your responsibility.
I recommend entering a maximum of 10% of the portfolio.
Good luck

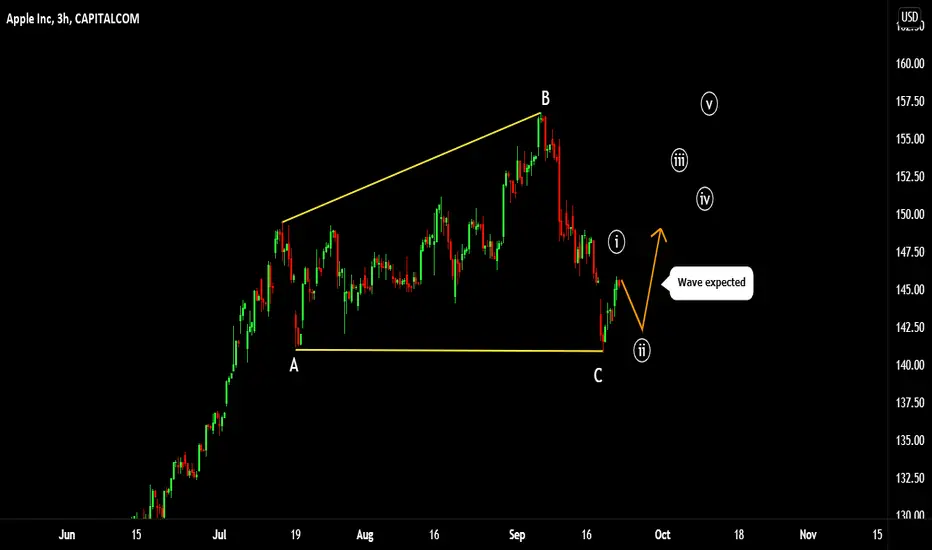
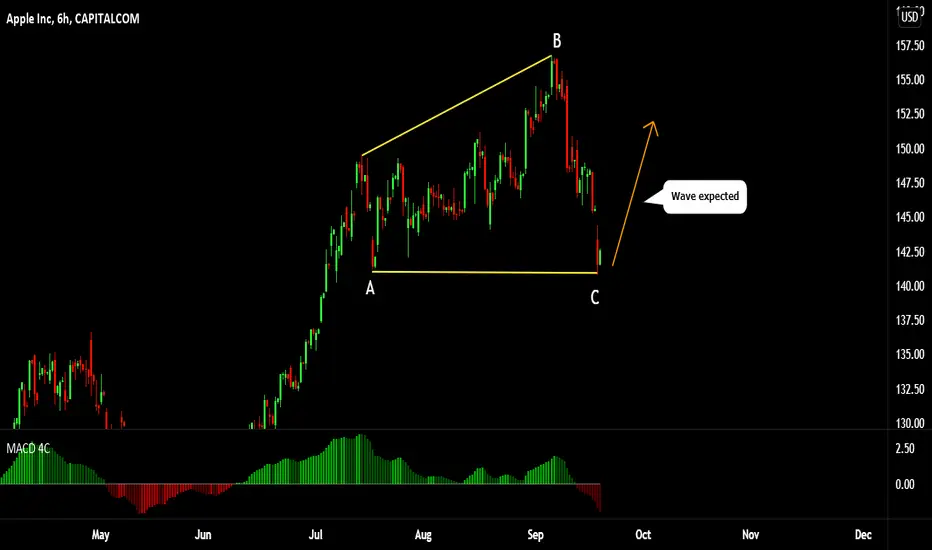
AAPL Tecnical AnalysisWe are seeing a pullback after the butterfly pattern. This retracement could bounce upwards in response from 0.618. Or it can be as long as 1.27 supply zones.
Therefore, I think that the region above the region I indicated with 0.618 may be suitable for buying, and the region below it may be suitable as the stop loss region.
When we look at the indicator data, it signals that the price will return from here.
Although Rsi is 34, if this descent extends to 0.618, the rsi value will have fallen below 20. A value of less than 35 seems reasonable for a buying opportunity. In other words, starting to collect from here seems like a suitable option to avoid being left out, even if there is a return.
I have an equation that I developed called W*2. I will not go into details, but according to this calculation made with both pattern and indicator data, one more shape should emerge.
The simulation image of this formula is as follows.
If the section that says score on the indicator script I wrote was above +0, it would be necessary to handle this image differently.
Of course, this is a newly developed equation. Your own strategy is always more valuable than the ideas of others. I am already doing this analysis to support you in making the right investment decision by comparing my opinion with your own strategies.
So you shouldn't consider this an investment advice.
Looking at the Aroon indicator, we might think that we might see sellers weakening and buyers getting ready to start a trend. According to my W*2 equation that I just mentioned, if we also calculate the shortness of the climb, I think the aroon up and aroon down will meet in the middle and the sellers will continue to go up again.
The estimated image that I expect to form on the indicators is as follows;
When we look at the trend indicators, we detect a positive dissonance in momentum. In other words, we can think of it as a signal that prices can return from here.
The fact that the ADx is above 30 also indicates that the downward trend has weakened.
When we look at the money indicators, we can think that the money inflow has started in the cmf and that this is a pullback according to the cmf data.
We can also see the falling wedge of the already emerging downtrend. So this decline may actually be a pullback.
I tried to show the angle of price averages with green bars in Atr. This may make us think that there is actually no real pullback in prices.
When the upturn begins and prices start to rise, a bearish line will begin to form at atr.
In summary;
I'm waiting for the prices to return from here.
I believe that the real breakdown will start then, by testing the 158s of the price.
NOTE: This is not investment advice.

Apple's text book Elliott's 5 waves structure of C or 3 !The beauty of Elliot wave . Does not get better than this.

AAPL (APPLE INC) BUYHi there.
Price is moving impulsively to the upside.
Wait for the price to form a continuation pattern and watch strong price action for buy.
Shorted AppleBearish RSI, Decreasing Volume, Evergrande is the new Lehman Bros. Wyckoff is everywhere

Apple The chart warned us 3 weeks agoHello everyone, as we all know the market action discounts everything :)
_________________________________Make sure to Like and Follow if you like the idea_________________________________
On August 24 I posted my analysis on the Apple stock and warned that a big divergence has been found between the market and the RSI and MACD indicators which usually indicates a drop in the market value and we can clearly see that it turned out to be a true sign.
Fear of contagion from China's Evergrande's potential collapse drove investors out of equities in a rush for safety on Monday, with the S&P 500 and Nasdaq suffering their largest daily percentage drops since May.
(NASDAQ:AAPL) was among the biggest drag on the Nasdaq and the S&P 500, Where the stock price dropped from 156.80 to 141.05. That's more than a 10% drop in less than 10 days.
The short-term trend is negative, but the long-term trend is still positive. So although the long term is still positive, this may be a trend turning.
Possible Scenarios for the market :
Scenario 1 :
The Market has broken the support line at 144.94 and now it looks like it will be headed to the support zone located at 138.42 where the Main battle will happen that will determine the direction of the market for the next period of time. If the bulls were able to gain control back over the market then we will be seeing a bounce in price that could lead the market to go back up but the buyers will have to show great power to be able to drive the price back up.
Scenario 2 :
The Market is nearing the second support at 141.88 and it looks like the bears are gathering more power by the minute and they will be able to push the market to 138.42 line the Bears will try to break that support in hope to push the market even lower and if there were able to do so then we might see a big drop happening in the stock price.
Technical indicators show :
1) The market is below the 5 10 20 50 MA and EMA (bearish short-term signs) but above the 100 and 200 MA and EMA (still bullish for the long-term)
2) The RSI is at 35.70 and looks like it could be headed to the oversold zone. A big divergence has been found before the drop
3) The ADX is at 22.42 showing that the market is trending with a negative crossover between FI+ (14.60) and DI- (31.11).
Daily Support & Resistance points :
support Resistance
1) 144.94 1) 148.00
2) 143.82 2) 149.94
3) 141.88 3) 151.06
Fundamental point of view :
The S&P 500 suffered its biggest slump since May, amid fears a debt crisis at China Evergrande Group could spark credit crunch in China's crucial real estate sector, leading to a potential economic crisis in the world's second-largest economy.
China Evergrande Group, the second-largest property company in China, has more than $300 billion in liabilities, and reports suggest it won’t hit an interest payment deadline on its offshore bonds due Thursday.
Tech participated in the broad-based selloff as investors appeared to take a breather from the ‘buy the dip’ mentally ahead of the Federal Reserve’s two-day meeting starting Tuesday. Google-parent Alphabet (NASDAQ:GOOGL), Apple (NASDAQ:AAPL), Facebook (NASDAQ:FB), Amazon (NASDAQ:AMZN) and Microsoft (NASDAQ:MSFT), ended mostly more than 3% lower. According to investing.com
This is my personal opinion done with technical analysis of the market price and research online from Fundamental Analysts and News for The Fundamental point of view, not financial advice.
If you have any questions please ask and have a great day !!
Thank you for reading.

AAPL (APPLE INC) BUYHi there.
Price is forming a possible continuation pattern to the upside.
Watch strong price action at the current levels for buy.
AAPL Daily TimeframeSNIPER STRATEGY (new version)
It works ALMOST ON ANY CHART.
It produces Weak, Medium and Strong signals based on consisting elements.
NOT ALL TARGETS CAN BE ACHIEVED, let's make that clear.
TARGETS OR ENTRY PRICES ARE STRONG SUPPORT AND RESISTANCE LEVELS.
ENTRY PRICE BLACK COLOR
TARGETS GREEN COLOR
STOP LOSS RED COLOR
DO NOT USE THIS STROTEGY FOR LEVERAGED TRADING.
It will not give you the whole wave like any other strategy out there but it will give you a huge part of the wave.
The BEST TIMEFRAMES for this strategy are Daily, Weekly and Monthly however it can work on any timeframe.
Consider those points and you will have a huge advantage in the market.
There is a lot more about this strategy.
It can predict possible target and also give you almost exact buy or sell time on the spot.
I am developing it even more so stay tuned and start to follow me for more signals and forecasts.
START BELIEVING AND GOOD LUCK
HADIMOZAYAN

AAPL (APPLE INC) BUYHi there.
Price is forming a reversal pattern to change its direction.
Watch strong price action at the current levels for buy.

APPLE FORECAST AFTER IPHONE 13✌️Hi Traders!
🍏In anticipation of the APPLE SPECIAL EVENT, I decided to share my thoughts on the value of Apple shares.
📱Authoritative analysts suggest that today Apple will show a rather boring line of Iphone 13 without any major innovations and killer features.
💥A fairly large update is waiting for the Apple Watch and AirPods today, but in my opinion they will not be able to greatly affect the situation.
👎Perhaps for the first time in many years, tech enthusiasts are not expecting anything special from Apple's special event, perhaps that is why the share price has fallen over the past 2 days from $ 157 to $ 149 per share.
I suppose that today and the next few days, the share price will fall to $ 142-140, then as the sale of new Iphones starts, the share price will start to rise again and I consider $ 160 as the nearest goal.

Apple will break out soon!Hello Boys and Girls :)
Today we take a look at the chart of apple. It had a nice run up until now but boy... look at that RSI. It is one hell of a divergence to the price action.
So for now we see the full pattern of this run and we can also see the near breakout in the chart. With the divergence and everything we see in the actual world, i will take some profits here.
Hope you all are good and safe out there.
Best Regards,
Jan

Wet Juicy $APPLE Ripe For Sell OffThe juicy apple looks to be ready for a nice investment as it drops to the ground in newton fashion.
If you know how well I predicted the last Apple sell off then you know I am not "wet behind the ears" when it comes to trading this successfully.
I've earned my stripes with this stock the hard way.
Tight stop losses at the climax high have just been taken out.
Tremendous liquidity created and room to drop lower to support and demand.
Things are clicking for the smart investors waiting below.

Apple Shares will Collapse this Year (I am buying this option)I hate stocks alright. I am also not a fan of apple. But I figured I'd turn the old money printer back on and buy a put option on apple for Nov 19 @ 135. Far out of the money, but it fits my risk tolerance and gives apple time to fall. Not financial advice, just saw an opportunity for myself and perhaps you guys too. My put is already up 60%, I'm holding till I feel apple has fallen enough, but take profits when you want. I am expecting apple shares to fall below 135 as
a major selloff occurs in the stock market. It may be this year, maybe next, but it will happen. Apple shares are in a bearish pattern (distribution), and also has bad press as privacy concerns arise.

AAPL LONG SET UP TO ($145-$160)Title/(Date): AAPL (Apple)
Asset:STOCK
Order Type: Market Buy/Buy Limit
Time Frame:4hr
Entry Price 1: $136.00(Active)
Entry Price 2: $131.00(Pending)
Stop Loss: $126.00
Take Profit 1: $141.00 (50 Pips)
Take Profit 2: $146.00 (100 Pips)
Take Profit 3: $151.00(150 Pips)
Take Profit 4: $156.00 (200 Pips)
STATUS- ACTIVE
Jun-24-21 Reiterated Morgan Stanley Overweight $161 → $162
May-28-21 Downgrade New Street Neutral → Sell $90
Apr-29-21 Upgrade Goldman Sell → Neutral $83 → $130
Apr-06-21 Reiterated Morgan Stanley Overweight $164 → $156
Mar-31-21 Upgrade UBS Neutral → Buy $115 → $142
Jan-28-21 Reiterated Needham Buy $140 → $170
Jan-28-21 Reiterated Monness Crespi & Hardt Buy $144 → $170
Jan-28-21 Reiterated Canaccord Genuity Buy $150 → $155
Jan-25-21 Reiterated Wedbush Outperform $160 → $175
Jan-22-21 Reiterated Cowen Outperform $133 → $153
Jan-21-21 Reiterated Morgan Stanley Overweight $144 → $152
Jan-05-21 Reiterated Canaccord Genuity Buy $145 → $150
Dec-16-20 Reiterated Morgan Stanley Overweight $136 → $144
Dec-09-20 Reiterated Wedbush Outperform $150 → $160
Nov-30-20 Upgrade Loop Capital Hold → Buy $110 → $131
Oct-26-20 Resumed Atlantic Equities Overweight $150
Sep-21-20 Reiterated Citigroup Buy $112.50 → $125
Sep-17-20 Reiterated Jefferies Buy $116.25 → $135
Sep-16-20 Reiterated Needham Buy $112.50 → $140
Sep-14-20 Reiterated Oppenheimer Outperform $105 → $125

Apple Stock Daily Analysis, RSI & MACD Divergence Hello everyone, as we all know the market action discounts everything :)
_________________________________Make sure to Like and Follow if you like the idea_________________________________
The Apple inc Stock has been doing very well for itself in the last couple of months, Both the short-term and long-term trends are positive. This is a very positive sign.
AAPL is currently trading near its 52 week high, which is a good sign. The S&P500 Index however is also trading near new highs, which makes the performance in line with the market.
An RSI Divergence has been found between the stock and the indicator, which could indicate a drop in price for the next period of time, But knowing that the Stock is still doing very well but there are signs that the price could be dropping other than the RSI, The MACD is having a Negative crossover and a divergence but still shows that the market is Bullish, And the stock price has reached the Bollinger Bands upper end which could indicate a small drop.
Scenarios for the market :
Scenario 1 :
The market has reached the resistance level at 148.86 and now it's trending above it with no confirmation of a breakout yet, but if the Bulls keep on pushing then we will see a breakout at that level and the price will keep going up reaching the 150.58 resistance area where the Bull power will be tested by the Bears in hope to drive the price back, If the Bulls were able to prove them self then we could see the price going back to the 151.68 range which was the all-time high for this stock.
Scenario 2 :
The market is trending 149.71 and it reached the resistance level at 148.86, We did notice an RSI divergence and a Negative crossover between the MACD line and the Signal line plus a MACD divergence, And the market almost hitting the upper band in the Bollinger bands. With all of that, the market is still holding a Bullish position but these signs could affect the market and a drop will happen where the price will be headed near the support zone from 147.14 - 146.10 where the Bulls will try to win back control again.
Technical indicators show:
1) The market is above the 5 10 20 50 100 200 MA and EMA (Strong Bullish Sign)
2) The RSI is at 60.41 showing great strength in the market, with a divergence between the indicator and the market which could indicate a drop.
3) The MACD is above the 0 line showing that the market is in a Bullish state, Negative crossover between the MACD line and the Signal line. With a divergence between the indicator and the market.
4) The Bollinger Bands are showing a squeeze which could indicate that a huge move is coming soon.
Support & Resistance points :
support Resistance
1) 147.14 1) 148.86
2) 146.10 2) 149.54
3) 145.42 3) 150.58
Fundamental point of view :
AAPL's Return On Assets of 26.32% is amongst the best returns of the industry. AAPL outperforms 97% of its industry peers. The industry average Return On Assets is 1.29%. And its Profit Margin is 25.00%, The industry average is 2.10%. AAPL outperforms 97% of its industry peers.
Based on estimates for the next 5 years, AAPL will show a quite strong growth in Earnings Per Share. The EPS will grow by 12.37% on average per year.
South Korea is likely to bar Google and Apple from requiring software developers to use their payment systems, effectively stopping them from charging commissions on in-app purchases, the first such curbs on the tech giants by a major economy.
For Apple, commissions from in-app purchases are a key part of its $53.8 billion services business and are a major expense for some app developers.
This is my personal opinion done with technical analysis of the market price and research online from fundamental analysts and news for The Fundamental point of view, not financial advice.
If you have any questions please ask and have a great day !!
Thank you for reading.

Apple ( $AAPL ) Break Out Confirmed$AAPL closed above $150.00 yesterday confirming break out of bullish pennant pattern. Showing strength in today's red markets. Look for $AAPL to test $155.00. After that, there is a high likelihood of the stock bouncing back to the bottom of the channel...

Apple stock potential breakout soon!!Apple has formed a bullish pennant pattern and is looking to breakout very soon! Look for $155 in the near future.

APPLE: FUNDAMENTAL ANALYSIS+PRICE ACTION & NEXT TARGET|LONG🔔All of the headlines are true. The iPhone is indeed losing market share - in some ways.
While some of this loss can be attributed to unpredictable failures caused by the pandemic, some cannot. After all, COVID-19 has made life equally difficult for all smartphone manufacturers. But some of them still found a way to poach potential buyers of other brands.
Perhaps most notably, the market share of low-cost phones increased significantly last quarter, implying that numerous customers are no longer willing to buy devices with a four-figure price tag. We're even seeing indirect indications that this shift is happening in North America, Apple's most important market.
The thing is, it doesn't matter when you examine the rest of the data.
The data provider is IDC, a technology market research company that publishes the estimated number of smartphones released by each major manufacturer in any given quarter.
According to IDC, Apple sold 44.2 million iPhones in the three months ending in June, a 17.8 percent increase over last year's coronavirus-covered second quarter. That's not bad, even if the numbers come with a pandemic disclaimer. This growth is certainly ahead of Samsung's 9.3% year-over-year increase in shipments, even though Samsung shipped a much larger number of devices -- 59 million.
However, it is curious. Lesser-known smartphones such as OPPO and Vivo increased their shipments by 37% and 33.7% (respectively) last quarter, while Xiaomi increased its shipments by 86.6% year-over-year, ranking second with 53.1 million devices.
An isolated incident? Maybe, maybe not.
Apple's 14.1% share last quarter is better than its 13.5% share in the second quarter of last year and much better than its 10.2% share in the second quarter of 2019. Indeed, the average market share of 16.3% over the past four quarters is higher than Apple's typical 14% share, driven by an especially triumphant fourth quarter that saw the company's smartphone market share rise to 23%. However, the company was unable to hold on to much of the success caused by pandemic circumstances, such as an incredible 23.3% in the fourth quarter and 16% in the first.
It would also be shortsighted to ignore the fact that much of the iPhone's recent success in the market is a reflection of Huawei's absence and Samsung's failure to connect with customers, as well as Apple's marketing power. These two names are usually the main threats to Apple in the high-end phone market, but now they are virtually powerless.
And even so, Apple doesn't manage to knock them out of business. According to GlobalStats, after peaking at 28.8 percent in April 2020, the number of actively used iPhones worldwide has dropped to 26.9 percent. At the end of 2018, 56.8 percent of smartphone owners in North America were using iPhones, but after another decline in the first half of this year, they now account for 53.6 percent of actively used smartphones. Clearly, consumers are finding other smartphone options rather than gravitating toward the most recognizable name in the business.
However, Apple shareholders should not panic just yet.
This dynamic underscores the danger of a one-sided view of anything: there's always more.
Part of the story is that while Apple is losing market share, that doesn't mean it's selling fewer smartphones. The company is simply getting a smaller share of the current overall market growth after holding on to a significant portion of its share when the market itself began to shrink in 2018. Apple still sold an average of 57.8 million iPhones in each of the past four quarters, registering its highest year-over-year sales rate since 2015, when the iPhone 6 redefined what a smart mobile device could be. The overall smartphone market is still much smaller than it was at the peak of 2017.
And lest you think that the last four quarters are strong just because sales fell in the first two quarters of 2020, that's not true. Despite the effects of the pandemic, Apple managed to sell more smartphones in the first and second quarters of 2020 than in the first two quarters of 2019.
Another reason that shrinking market share is not an existential threat for Apple is that the company does an incredible job of extracting revenue from iPhone owners once they get into the iOS ecosystem.
Sensor Tower's data put things in perspective. The app market research company estimates that in 2020, the average U.S. iPhone owner will spend $138 on apps and other digital content from their device. That figure marks five consecutive years of spending growth from 2015 when the annual average was just $33. That's even more impressive given that, according to Sensor Tower, Apple's App Store generated about twice as much revenue worldwide in 2020 as Alphabet's Google Play, even though there are almost three times as many users of Alphabet's Android operating system as iOS users.
And more divergence is expected on that front. The iPhone 12 Pro may start at $1,000 apiece and go up quickly, but the new iPhone SE draws new consumers to iOS, starting at a more affordable price of $400 apiece.
Should Apple investors be watching the iPhone market share trend? Sure. It may not suggest much right now, but things are changing. There will come a time when an alternative to the iPhone will enthrall enough consumers to start reducing not only Apple's smartphone share but also its overall revenue.
If you're looking for a reason not to buy stock in the world's largest and most profitable company right now, narrowing smartphone market share is not.

A look at the Apple stockA look at the Apple stock
First, I am against short selling stocks
Therefore, I see a negative view on this stock, which is an area of exchange or profit taking
You can take profits in these areas and buy back near the rising trend line
The general trend is up, the foundational trend is up
The secondary trend is bullish “close to the break” waiting for the break
Negative divergence on the weekly frame
A decrease in trading volumes with the current heights


AAPL Breakout !Made new All-Time HIgh on Friday
10 Month-long Ascending Triangle
Price well above 200 DMA
Decent Volume
Earnings coming up
