APT

APT - 15% rise of Open interest - big move is comingAPT - 15% rise of Open interest - big move is coming
In a video i compared it with LINK example
watch full update


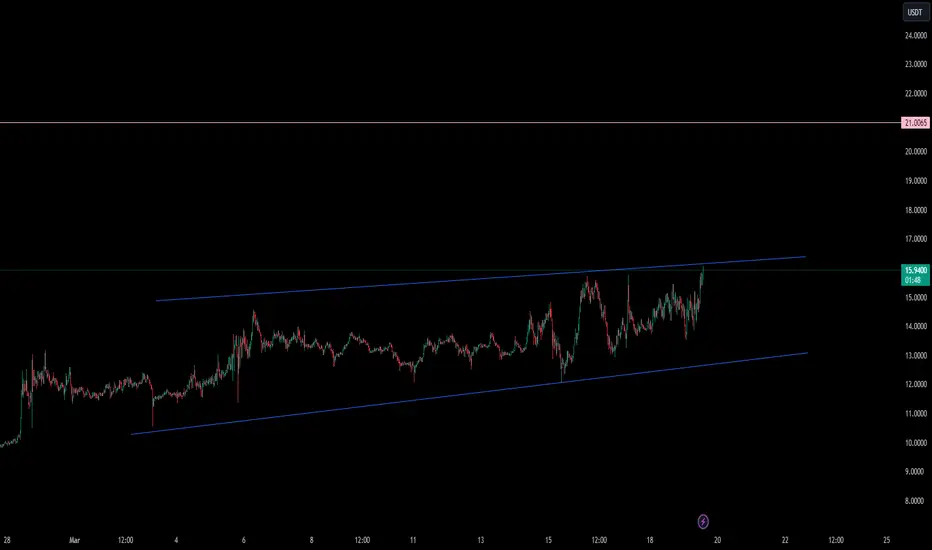
APT: Channel UpTrade setup : Price is in an Uptrend, showing relative strength as it continues to advance even during an overall market correction. Bullish break above $15.00 resistance signals continuation of an Uptrend with +10% upside potential to $16.75 near-term. Stop Loss (SL) at $13.90.
Pattern : Price is trading in a Channel Up pattern. With emerging patterns, traders who believe the price is likely to remain within its channel can initiate trades when the price fluctuates within its channel trendlines. With complete patterns (i.e. a breakout) – initiate a trade when the price breaks through the channel’s trendlines, either on the upper or lower side. When this happens, the price can move rapidly in the direction of that breakout.
Trend : Uptrend across all time horizons (Short- Medium- and Long-Term).
Momentum is Bullish (MACD Line is above MACD Signal Line and RSI is above 55).
Support and Resistance : Nearest Support Zone is $13.00 (previous resistance), then $11.00. The nearest Resistance Zone is $15.00, which it broke, then $16.75 and $20.00.

APT (Y24.P1.Video1).Cup and Handle, or just parabolic?Hi Traders,
Here are my thoughts on what is taking place, what levels are worth taking a long and what assumptions I have to think these target levels are possible.
All the best,
S.SAri

APT (Y24.P1.E2) Potential parabolic or Cup&HandleHi Traders,
#APT has been going well and held up with the recent pulbback...it didn't.
Its at resistance and like RNDR, has the makings of a parabolic structure along with a potential cup and handle.
A pullback to the grey zone would be the handle for wave 4.
All the best,
S.SAri

APT bullish idea Apt is in clear uptrend but it's creating Trendline Liquidity below and which is good sniper Entry zone around 13-50-13.80.
Keep eye on it and do your analysis before taking any action.

APT NEW INCREASE VOLUMEAPT shows a new increase in volume, which could be confirmed in the coming time frames.
We will follow the coin to see if it's able to confirm.
The reason for the volume is the trend data that this coin shows.
This coin is at basic choice on daily trends.
APT : SHort trigger has been activatedBINANCE:APTUSDT
JUST See how you can find a new short-entering position.
it breakdown the trend line, and may provide a good opportunity for quick short

APTUSD 1WAPT ~ 1W 📈
#APT Make purchases gradually after breaking through this resistance line, with a target of at least 20%++

APT: 2-type position📊Analysis by AhmadArz:
🔍Entry:
buy: 13.409
sell: 13.952
🛑Stop Loss:
buy: 13.173
sell: 14.604
🎯Take Profit:
buy:13.62-13.95
sell: 13.45-13.06-12.62-12.19
🔗"Uncover new opportunities in the world of cryptocurrencies with AhmadArz.
💡Join us on TradingView and expand your investment knowledge with our five years of experience in financial markets."
🚀Please boost and💬 comment to share your thoughts with us!

APT / APTUSDTGood Luck >>
• Warning •
Any deal I share does not mean that I am forcing you to enter into it, you enter in with your full risk, because I'll not gain any profits with you in the end.
The risk management of the position must comply with the stop loss.
(I am not sharing financial or investment advice, you should do your own research for your money.)

#APTIn time d1, it is moving in an ascending channel. After several retests of the previous major ceiling, a corner pattern is currently forming. To continue the upward path, it must break the range of 9.38 to be able to reach the supply area in time d1. Therefore, it can fluctuate in this range for the time being, and breaking $9.37 will pave the way for the currency to rise.
Please support this idea with a LIKE and COMMENT if you find it useful and Click "Follow" on our profile if you'd like these trade ideas delivered straight to your email in the future.
Thanks for your continued support.
Sincerely.

APT/USDT Main trend. Wedge. Logarithm. Timeframe 3 days. It is forming, as on many mid-liquidity altcoins—a descending wedge.
Here's what it looks like on a line price chart .
Pivot Zones. Trading Strategies. .
At the moment, the drop is -76%. Usually assets of this liquidity fall by -90%, but perhaps now is not the time yet or there is too much hype for cryptocurrency. You can work from the average set/reset price, i.e. allocate money in advance. Another option is to wait for the breakdown of the wedge.
Risk and mani-management.
Remember that with the general market situation, localized takeouts (squeezes) of stop-losses are possible. More globally, do not rule out the possibility of a so-called "black swan" (not a crypto story) since 03 2020 at the dumping of the crown virus. Then the descending wedge can break with one stick - squeeze (like the whole market), and no matter how beautiful the chart of this cryptocurrency looked earlier. If that happens, only buy with a net of orders and disconnect from media news scaremongering.
Scare and save, this is the essence of wolves earning money and loss of funds of illusorily scared and then saved sheep. .
In any case, the descending wedge has been formed (bullish formation), breaking through its resistance (breaking the downtrend) is a matter of time, not the action itself. Moreover, this very HYIP and something "valuable" should be sold (create HYIP and media demand) to those who do not appreciate such things and do not divide cryptocurrencies into good and bad, because they are just tools with the help of which "out of nothing" you can make fabulous money on the faith of fools in something abstract.
Do not catch the lows and highs of the trend. Work logic like the big market participants:
"I never know the exact future, but there is a more likely or less likely scenario, those are the ones I stick to. I am prepared for any localized outcome of events, even the less likely". Absolutely not interested in crypto news and majority opinion" .

APT: Resistance BreakoutTrade setup : Price resumed its Uptrend. Bullish break above $13.00 resistance signals continuation of an Uptrend with upside potential to $15.00 near-term and $16.75 mid-term. Stop Loss (SL) at $12.00.
Trend : Uptrend across all time horizons (Short- Medium- and Long-Term).
Momentum is Bullish (MACD Line is above MACD Signal Line and RSI is above 55).
Support and Resistance : Nearest Support Zone is $11.00 (previous resistance), then $10.00. The nearest Resistance Zone is $13.00, which it broke, then $15.00.

Aptos $12.20 ➥ $20.00 - $125.00Aptos $12.20 ➥ $20.00 - $125.00
Take profit - $20.00 (10%)
Take profit - $27.50 (10%)
Take profit - $29.00 (10%)
Take profit - $36.00 (10%)
Take profit - $50.00 (10%)
Take profit - $60.00 (10%)
Take profit - $70.00 (10%)
Take profit - $90.00 (30%)

APTUSDT Long IdeaBINANCE:APTUSDT has recently done break out on one day time frame and we still haven't got any retest of the support which I believe has a less chance as majority of the traders are very bullish on this coin and the dips are filling quickly but if we get the chance the black box is the area to enter

APT/USDT Keep an eye on the support, If bounce APT will back UP!💎APT has recently shown significant market dynamics. Currently, APT is facing rejection after testing the Bearish OB zone and is now retesting the support area around 10.85 to generate new momentum for a breakout.
💎 If APT successfully breaks above the supply area, its probability could signal a continuation of the upward movement, potentially leading to reaching our target area.
💎 However, if APT fails to maintain the support area and breaks below it, the next critical level is the Bullish OB area. APT must bounce from this area, as failure to do so could result in losing the support trendline.
💎 If this occurs, APT may switch back to a downward trajectory, continuing further downward movement.

APT/USDT Perfect Bounce, Ready for continue Upward Move!💎 APT has been drawing significant attention in the market with its recent performance. It has recently made a noteworthy bounce from a demand zone, underscored by the closure of the daily candle with a robust green indicator.
💎 Should this bounce prove to be a reliable signal, APT might well be on its path to an upward trajectory, probability aiming for the targeted bearish OB area.
💎 However, if APT fails to maintain its upward momentum and revisits the demand area, it will be crucial for it to hold and rebound from this level.
💎 Failure to do so could indicate a break in the bullish trend. In such a scenario, there's a potential for APT to embark on a downward journey, moving towards the support area and possibly extending further to a lower, more robust support zone. The market's response in these key areas will be critical in determining APT's future direction.

APT/USDT Potential Uptick from Key Demand Zone? 🚀APT💎 Paradisers, gear up for a thrilling trade with #APTUSDT, now finding its footing at an essential demand zone, signaling a possible market move.
💎 Diving into #APTOS latest moves, it's apparent that it fell short of breaking past its previous high, stirring up bearish vibes. Yet, a bullish shift seems on the horizon from the demand level of $9.3298. With momentum on our side, we're eyeing a climb capable of surpassing the looming resistance.
💎 Should momentum for AMEX:APT begin to fade, a bullish revival from the solid support at $7.8646 is what we're looking out for. However, dipping below this critical level may indeed mark a transition towards a deeper bearish phase

APT pumping WITH OI increasingAPT pumping WITH OI increasing
Follow the trend after some range or pullback take entry for LONG

APT/USDT: APT Trade EntryWe are considering a scenario of the beginning of APT purchases.
Since the beginning of the second half of October, the asset has been demonstrating an upward trend, starting from the price level of $4.7926 and reaching $11.0934. This growth amounted to over 130%.
At the moment, APT is undergoing a correction and is trading around the inclined resistance level. The POC volume level is also close to this resistance level.
We are entering a trade on APT with the expectation of growth to the price level of $11.0934, which is more than 16%. Upon reaching this price, we plan to partially close the position, leaving it open in case of buyer activity and positive market sentiment.
Then we will hold the position until the next target at the price level of $12.9259.

Longing Aptos to $11I’ve got another trade for you all here in Aptos. Nearly all of my signals are flashing green on APT. I can’t sit the sidelines waiting on Bitcoin here. I’m in at $9.50. Targeting $11+. SL is $8.73 (just under the VRVP PoC) for a 2/1 rrr.
