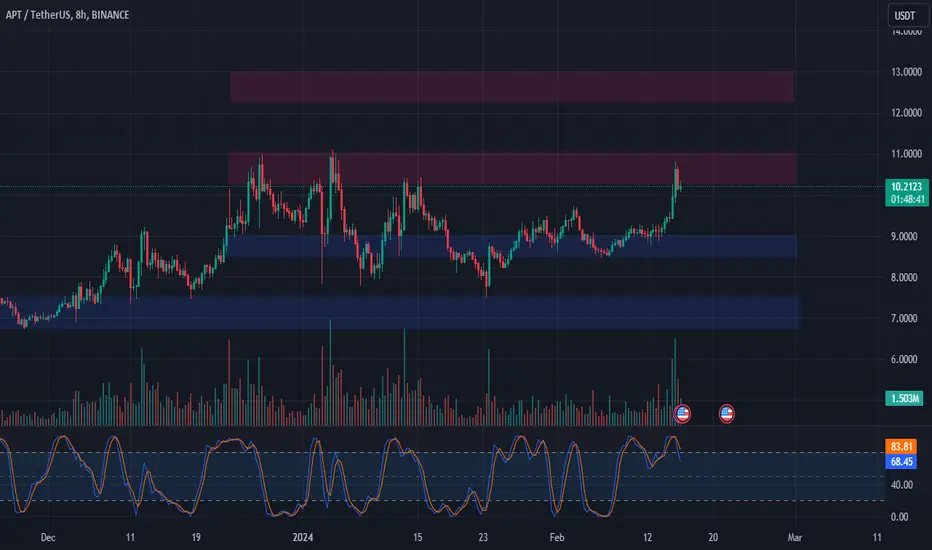
📈🛍️ APT Trade Analysis - Testing Resistance! 🚀💹📊 Technical Overview:
APT: Testing resistance at $10.30 - $11.00.
Key Levels: $10.30, $11.00, $9.00, $12.30, $13.00.
📉📈 Trade Analysis:
Resistance Test: APT testing the resistance area.
Overbought: Overbought on the 8-hour chart.
Support Levels: Potential support at $9.00.
Long Trade Plan: Consider entering a long trade if $9.00 holds.
Profit Targets: $10.30 - $11.00, $12.30 - $13.00.
Potential Gain: Roughly a 45% gain from $9.00 to $13.00.
Stop Loss: Below $8.50.
🚀🔄 Note: Monitor price action around $9.00 and adjust trade strategy accordingly. 📊💡 #APT #TradeAnalysis #StockMarket 📈📉
APT
FLUXWould love to get me some conflux right now...
Total3 seems to be setting up, why not give this small cap a shot? target is the 618 fib, buying spot at market with a weekly ssl.

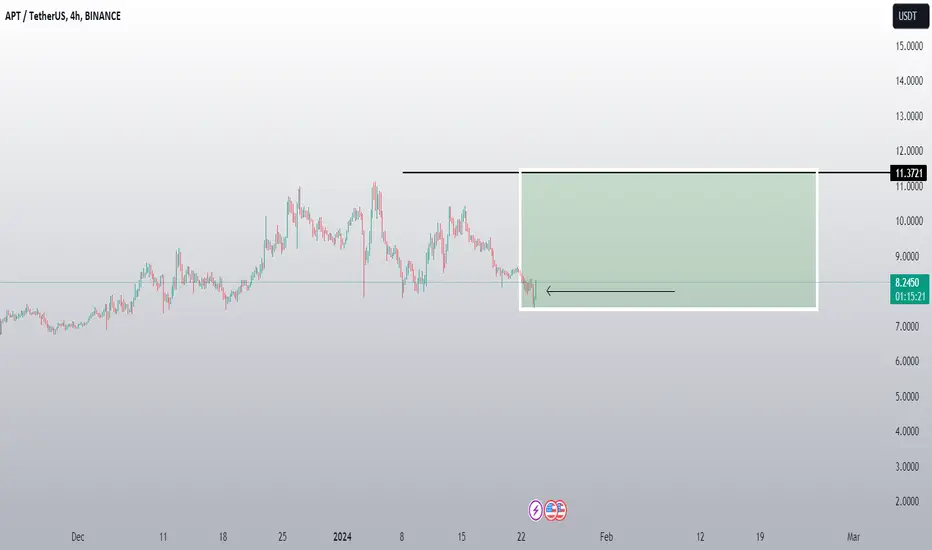
APT ANALYSIS (4H)From where we have inserted "Start" on the chart, a correction has been created, which looks like a diametric (or symmetrical) one.
We now seem to be in the G wave of this diametric. We expect to move from the specified supply side to the Demand side.
For risk management, please don't forget stop loss and capital management
When we reach the first target, save some profit and then change the stop to entry
Comment if you have any questions
Thank You

Nice Combo-APTAPT a Layer 1 based on MOVE. In the early days of its launch, it relied on airdrops and a star team to attract many people. However, in the process of this round of rise, the performance is inferior to that of SUI, which is also based on MOVE. In TVL's ranking, it fell to outside TOP20. APT is our protagonist today.
After reading the previous articles, you must be familiar with our indicators. You can see that the TSB indicator gave a SELL signal yesterday. This means APT is entering a bearish trend and you can open a short position. This is a independent perfect operation.
In addition to the TSB indicator, you can see that APT is falling with fluctuation, which meets the conditions of the KDMM indicator. On the daily KDMM indicator, the bullish momentum is gradually fading, which is consistent with the signal given by the TSB indicator.
And at the 4h level, the KDMM indicator is at a high level, and the bearish momentum is also significantly increasing.
This is a classic scenario of indicator coordination. While trend indicators are giving signals, momentum indicators are also changing. Of course, you can operate independently according to TSB. The purpose of introducing the KDMM indicator is to let you know what the situation is.
Introduction to indicators:
Trend Sentinel Barrier (TSB) is a trend indicator, using AI algorithm to calculate the cumulative trading volume of bulls and bears, identify trend direction and opportunities, and calculate short-term average cost in combination with changes of turnover ratio in multi-period trends, so as to grasp the profit from the trend more effectively without being cheated.
KDMM (KD Momentum Matrix) is not only a momentum indicator, but also a short-term indicator. It divides the movement of the candle into long and short term trends, as well as bullish and bearish momentum. It identifies the points where the bullish and bearish momentum increases and weakens, and effectively capture profits.
Disclaimer: Nothing in the script constitutes investment advice. The script objectively expounded the market situation and should not be construed as an offer to sell or an invitation to buy any cryptocurrencies.
Any decisions made based on the information contained in the script are your sole responsibility. Any investments made or to be made shall be with your independent analyses based on your financial situation and objectives.

APT: Descending TriangleTrade setup : Trends are mixed. Price is consolidating in a Descending Triangle pattern. We wait for a breakout.
Pattern : Price is trading in a Descending Triangle pattern. Typically, a breakout will occur in the direction of the existing trend. Most traders will take a position once the price action breaks through the bottom line of the triangle with increased volume, which is when the price should decline an amount equivalent to the widest section of the triangle.
Trend : Neutral on Short- and Medium-Term basis and Uptrend on Long-Term basis.
Momentum is Mixed as MACD Line is above MACD Signal Line (Bullish) but RSI ~ 50 (Neutral).
Support and Resistance : Nearest Support Zone is $8.00 (previous resistance), then $5.40. The nearest Resistance Zone is $10.00, then $12.50.

In mid big candle(APT)📊Analysis by AhmadArz:
🔍Entry: 8.186
🛑Stop Loss: 8.080
🎯Take Profit: 8.311 -8.418 -8.610 -8.742
🔗"Uncover new opportunities in the world of cryptocurrencies with AhmadArz.
💡Join us on TradingView and expand your investment knowledge with our five years of experience in financial markets."
🚀Please boost and💬 comment to share your thoughts with us!

APT NEW VOLUME INCREASEThank you for reading this update.
Depending on our study we see that APT has a good chance of volume increase.
This updates depending on day trade, And the market should confirm with time the right market way.
We did follow before more coins, and these coin seems to have an increase of break in the coming time.
#Nottradingadvice
#For Day traders take always profits when the market increase
#Expect nothing from the markets, but follow what it shows.
APT Structure Turns To Bearish!!!APT changed its structure from bullish to bearish after making a double top with divergence and breaking HL, Now it will hopefully retest the current resistance for making new LH and go towards the target.
Entry: Cmp and 9.82
Tp: 8.39
Sl: 10.43

I Cannot Short This !!! situation+next targets.Hi.
Time to break out of the rounding bottom on weekly & also above the key level.
AB=CD
✅Thank you, and for more ideas, hit ❤️Like❤️ and 🌟Follow🌟!

APT: Channel UpTrade setup : Price is in an Uptrend, trading in a Channel Up pattern. Swing Traders: can trade the Channel (enter near $8 support and exit near $11 channel resistance trendline), Stop Loss (SL) level at $7.40 (just below prior swing low and nearest support). Trend Traders wait for a breakout from Channel Up pattern.
Pattern : Price is trading in a Channel Up pattern. With emerging patterns, traders who believe the price is likely to remain within its channel can initiate trades when the price fluctuates within its channel trendlines. With complete patterns (i.e. a breakout) – initiate a trade when the price breaks through the channel’s trendlines, either on the upper or lower side. When this happens, the price can move rapidly in the direction of that breakout.
Trend : Neutral on Short-Term basis and Uptrend on Medium- and Long-Term basis.
Momentum is Mixed as MACD Line is below MACD Signal Line (Bearish) but RSI ~ 50 (Neutral). MACD Histogram bars are rising, which suggests that momentum could be nearing another upswing.
Support and Resistance : Nearest Support Zone is $8.00 (previous resistance), then $5.40. The nearest Resistance Zone is $10.00, then $12.50.

APTUSDT → Potential for further growthBINANCE:APTUSDT forms support 8.08 and pre-breakdown consolidation, within which it breaks the trend resistance.
After breaking the resistance, the market forms a local high of 11.1 after which it tests the previously broken trend resistance and the support of 8.08. The market is trying to change the trend and it is logical on the growth of the total market capitalization. Technically, the coin has a good enough potential to catch up with other coins in growth.
It is worth paying attention to the zone of 9.220 - 8.08. The bulls are trying to hold this area, increasing their volume. It is worth waiting for the price to consolidate above this area to confirm the bullish potential. The moving averages are supporting the market, and the false break of MA-50 gives a good signal.
Resistance levels: 10.9, 12.67
Support levels: 9.22, 8.08
It is worth considering the potential for buying at the moment. A price consolidation above 9.22 will give a good place to open a trade.
Regards R. Linda!

APT: Channel UpTrade setup : Price is in an Uptrend, trading in a Channel Up pattern. Swing Traders: can trade the Channel (enter near $8 support and exit near $10 resistance), Stop Loss (SL) level at $7.40 (just below prior swing low and nearest support). Trend Traders wait for a breakout from Channel Up pattern.
Pattern : Price is trading in a Channel Up pattern. With emerging patterns, traders who believe the price is likely to remain within its channel can initiate trades when the price fluctuates within its channel trendlines. With complete patterns (i.e. a breakout) – initiate a trade when the price breaks through the channel’s trendlines, either on the upper or lower side. When this happens, the price can move rapidly in the direction of that breakout.
Trend : Neutral on Short-Term basis and Uptrend on Medium- and Long-Term basis.
Momentum is Mixed as MACD Line is below MACD Signal Line (Bearish) but RSI ~ 50 (Neutral).
Support and Resistance : Nearest Support Zone is $8.00 (previous resistance), then $5.40. The nearest Resistance Zone is $10.00, then $12.50.

APT. Correction is overdue.APT has been overbought for several months while simultaneously being in an upward trend. Given the future global correction ahead of the major bull market, it is reasonable to short and expect at least a 20% decline. Also, there is a chance to buy an asset 37% below current prices.

Small traget (APT)📊Analysis by AhmadArz:
Short TP
🔍Entry: 8.915
🛑Stop Loss: 8.83
🎯Take Profit: 9.006
🔗"Uncover new opportunities in the world of cryptocurrencies with AhmadArz.
💡Join us on TradingView and expand your investment knowledge with our five years of experience in financial markets."
🚀Please boost and💬 comment to share your thoughts with us!

APT: Pullback in UptrendTrade setup : Price is in an Uptrend. Now we wait for price to either 1) break above $10 to signal continuation of uptrend, with upside potential to $12.50, or 2) pull back near $8 support for a swing trade entry in Uptrend with upside potential back to $10. Stop Loss (SL) level at $7.40 (just below prior swing low and nearest support).
Trend : Uptrend across all time horizons (Short- Medium- and Long-Term).
Momentum is Bearish (MACD Line is below MACD Signal Line, and RSI is below 45).
Support and Resistance : Nearest Support Zone is $8.00 (previous resistance), then $5.40. The nearest Resistance Zone is $10.00, which it broke, then $12.50.

APT: Pullback in UptrendTrade setup : Price is in an Uptrend. Following a failed break above $10.00 resistance, price has pulled back to $8.00 support, which could be an attractive swing trade entry in Uptrend with upside back to $10.00 near-term and $12.50 medium-term. Stop Loss (SL) level at $7.75 (just below prior swing low and nearest support).
Trend : Uptrend across all time horizons (Short- Medium- and Long-Term).
Momentum is Mixed as MACD Line is below MACD Signal Line (Bearish) but RSI ~ 50 (Neutral).
Support and Resistance : Nearest Support Zone is $8.00 (previous resistance), then $5.40. The nearest Resistance Zone is $10.00, then $12.50.

APT/BTC - Aptos: BBand Breakout Super-Trend◳◱ On the $APT/ CRYPTOCAP:BTC chart, the Bband Breakout Super-Trend pattern suggests a pause in volatility, potentially gearing up for a breakout. Traders might observe resistance around 0.00024987 | 0.00027758 | 0.00032384 and support near 0.00020361 | 0.00018506 | 0.0001388. Entering trades at 0.0002417 could be strategic, aiming for the next resistance level.
◰◲ General info :
▣ Name: Aptos
▣ Rank: 32
▣ Exchanges: Binance, Gateio, Hitbtc
▣ Category/Sector: Infrastructure - Smart Contract Platforms
▣ Overview: None
◰◲ Technical Metrics :
▣ Mrkt Price: 0.0002417 ₿
▣ 24HVol: 78.934 ₿
▣ 24H Chng: 11.004%
▣ 7-Days Chng: 7.86%
▣ 1-Month Chng: 34.88%
▣ 3-Months Chng: 94.75%
◲◰ Pivot Points - Levels :
◥ Resistance: 0.00024987 | 0.00027758 | 0.00032384
◢ Support: 0.00020361 | 0.00018506 | 0.0001388
◱◳ Indicators recommendation :
▣ Oscillators: NEUTRAL
▣ Moving Averages: STRONG_BUY
◰◲ Technical Indicators Summary : BUY
◲◰ Sharpe Ratios :
▣ Last 30D: 2.68
▣ Last 90D: 2.78
▣ Last 1-Y: 1.25
▣ Last 3-Y: 0.45
◲◰ Volatility :
▣ Last 30D: 1.12
▣ Last 90D: 0.88
▣ Last 1-Y: 1.12
▣ Last 3-Y: 1.20
◳◰ Market Sentiment Index :
▣ News sentiment score is N/A
▣ Twitter sentiment score is N/A
▣ Reddit sentiment score is 0.68 - Bullish
▣ In-depth APTBTC technical analysis on Tradingview TA page
▣ What do you think of this analysis? Share your insights and let's discuss in the comments below. Your like, follow and support would be greatly appreciated!
◲ Disclaimer
Please note that the information and publications provided are for informational purposes only and should not be construed as financial, investment, trading, or any other type of advice or recommendation. We encourage you to conduct your own research and consult with a qualified professional before making any financial decisions. The use of the information provided is solely at your own risk.
▣ Welcome to the home of charting big: TradingView
Benefit from a ton of financial analysis features, instruments and data. Have a look around, and if you do choose to go with an upgraded plan, you'll get up to $30.
Discover it here - affiliate link -

APTUSD - Recovery Pattern (INVERTED H&S)A slightly slanted inverted H&S but still valid due to the head being low than both shoulders
I expect a strong right shoulder move up to the solid green line, quite a big move.
I have labelled the points of the head and shoulder structure.
The whole market looks VERY bullish to me right now.

APTUSD - Bullish IdeaAn idea for APTUSD comparing a previous bullrun to the one that is emerging now
A lower low can be seen in both situations leading to the bull run, this is shown in the white box and the green dotted line.
I do not have a price target but it should surpass the previous ATH.

APT: Resistance BreakoutTrade setup : Price broke above $10.00 resistance to signal continuation of uptrend, with upside potential to $12.50. Stop Loss (SL) level at $8.90.
Trend : Uptrend across all time horizons (Short- Medium- and Long-Term).
Momentum is Bullish (MACD Line is above MACD Signal Line and RSI is above 55).
Support and Resistance : Nearest Support Zone is $8.00 (previous resistance), then $5.40. The nearest Resistance Zone is $10.00, which it broke, then $12.50.

Wait for my confirmations(APT)❤️❤️Thanks for boosting 🚀 and supporting us!
📈My endorsements for selling resistance:
Hoping to reach the roof of the channel
Completing the second movement width from the floor
Last bullish push to sell
📌A small buy position is only to reach resistance.
📊 (sell) : 9.699
🔴 Stop Loss : 10.602
🎯 Take Profit : 8.511-7.373-6.431-5.037
🔗 For more communication with us, In the footnote and send a message in TradingView.
👨🎓 Experience and Education: Our trading team has five years of experience in financial markets, especially cryptocurrencies.

$APT Chart AnalysisAptos AMEX:APT could make a high move if break the resistance at 7.85 and will making a golden cross by the end of November or early December this year.
This is not a financial advice, still do your own research.
Peace

APT: Resistance BreakoutTrade setup : Price broke above $8.00 resistance to signal continuation of uptrend, with upside potential to $10.00.
Trend : Uptrend across all time horizons (Short- Medium- and Long-Term).
Momentum is Mixed as MACD Line is below MACD Signal Line (Bearish) but RSI > 55 (Bullish). MACD Histogram bars are rising, which suggests that momentum could be nearing another upswing.
Support and Resistance : Nearest Support Zone is $5.40 (previous resistance), then $4.70. The nearest Resistance Zone is $8.00, which it broke, then $10.00.
