APT waiting for entry
APT has just broken the trendline since January 2023 (see screen-shot below), with at good candle (16% up).
I'll will wait for the retest of the range around $5.3-$5.4 to enter.
This area is a confluence of
The Fib 0.5 and Fib 0.6 (drawn for the today's candle of 16% raise)
The long-term trendline
EMA 50D
If prices come to this area, the proposed set-up is in chart.
Disclaimer:
This analysis is based on my personnal views and is not a financial advice. Risk is under your control.
APT

APT long setupAptos is one of the big projects with huge potential to pump in the bullrun...
In this chart we see a deviation on the lows... Wait for retest of SSL... Then pump

My plan for APTUSDThere is my plan for BINANCE:APTUSDT
⛔"Daily crypto market analyses I provide are personal opinions & not financial advice. Trading carries risks, so do your own research & seek advisor's help.#DYOR"
Don't forget to like and comment

🔥MAV and APT: SAME PATTERN, SAME PROFIT❓Both altcoins fell by -60-70% after the Binance listing and reached the accumulation area.
💥 what's next? I think you understand.
Such fresh altcoins as Aptos, Render, Worldcoin etc. are growing very easy and we make a profit on it, but every altcoin(!) depend on Bitcoin. Let's see what's daddy have for us during the upcoming days.
like❤️ and follow
Check the links and get a BONUS🎁 from me👇

APT SHORTJust like other altcoins, I believe APT coin will also fall due to Bitcoin's and the market's poor performance because there are no EMA or MA indicators below this level.

APT - accumulation in its last phaseAPT...
the hyped token of Jan 2023,
went for a correction in feb and march and first weeks of april...
its finally looking to finish the accumulation and looking to move towards new highs.
I am taking a long here...
I am looking for 25 - 27$ range.

APTOS is pressing the counter-trend - will this be growth?!Hello trader! Today I have a new idea for you. Like and subscribe to the channel, there is a lot of useful information there.✅
Friends, let's move away from BTC a little and pay attention to such an altcoin as APTUSDT, I will share my thoughts regarding the technical part.
I have been following this coin for a long time and watching how MM draws us an interesting pattern in the form of a downward global countertrend. And now the price is already starting to slowly tighten the trend line and I think that there will be some interesting moment ahead.
From the technical side: after the breakout of the countertrend we have two resistances ahead, the first in the range of $6.3 and the second in the 0.5 Fibonacci zone of $7.9 from which a strong correction may follow, since for a long time the buyer could not break through this zone and the price was in boletus and then a strong DUMP followed.
If I were making a trading decision at the moment, I would try to enter now for 2-3% of the deposit, no more than 2-3X per trade, but it’s best to just take the altcoin on short-term spot, it’s the safest.

5.2121-5.3743: Support zone for conversion to an upward trendHello?
Hello traders!
If you "Follow" us, you can always get new information quickly.
Please also click “Boost”.
Have a good day.
-------------------------------------
(APTUSDT chart)
(1D chart)
From a short-term perspective, it can be said that an upward trend is currently underway to transition to an upward trend.
Accordingly, the key is whether the price can be maintained above 5.3743 until the MS-Signal indicator switches to a bullish sign.
If that happens, it is expected to lead to a move to rise above 6.3793.
If it falls below 5.2121, there is a possibility that it will fall to around 3.5162, so you need to think about a response plan.
(1h chart)
In order to continue the upward trend, we need to check if we can receive support and rise in the 5.4616-5.6366 range.
However, if resistance is seen below 5.4973, caution is required as it may lead to a further decline.
At this time, it is necessary to check whether support is received around 5.1637-5.2406.
-------------------------------------------------- -------------------------------------------
** All explanations are for reference only and do not guarantee profit or loss in investment.
** Trading volume is displayed as a candle body based on 10EMA.
How to display (in order from darkest to darkest)
More than 3 times the trading volume of 10EMA > 2.5 times > 2.0 times > 1.25 times > Trading volume below 10EMA
** Even if you know other people’s know-how, it takes a considerable amount of time to make it your own.
** This chart was created using my know-how.
---------------------------------

APThas done the correction
have a good movement
support and resistant's are showing
good for investors

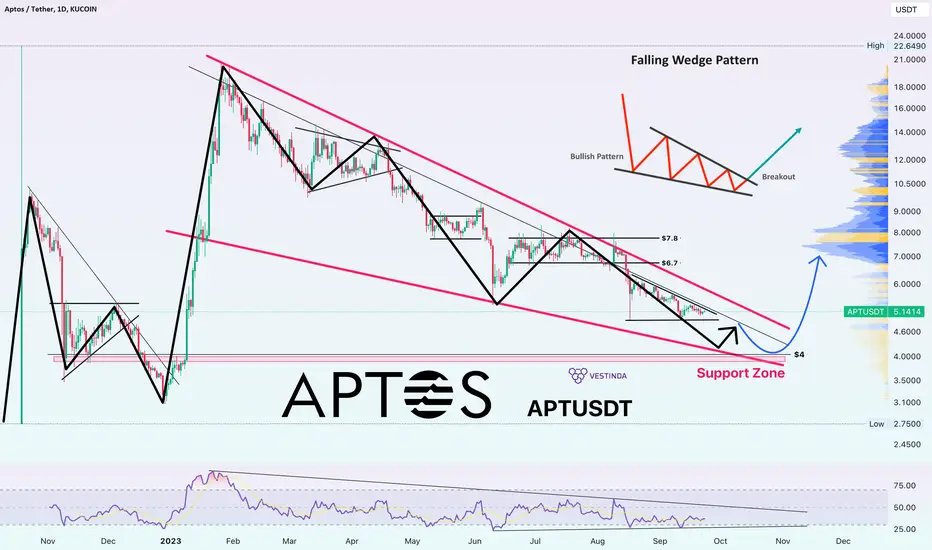
APTOS Potential : Falling Wedge 📉📈Understanding the Falling Wedge Pattern:
The falling wedge pattern is a bullish reversal pattern that occurs after a downtrend.
It's characterized by converging trendlines, with the upper trendline (resistance) sloping downward at a steeper angle than the lower trendline (support).
This pattern often suggests that selling pressure is weakening, potentially paving the way for a bullish move.
The Case for APT:
APT, like many cryptocurrencies, experienced a downtrend or consolidation phase.
The falling wedge pattern on the APT chart indicates that the price is trapped within this pattern, but it's essential to consider the broader context.
Potential Price Target:
The primary price target in a falling wedge pattern is often set at the highest point within the wedge.
This represents a critical resistance level that, if breached, can trigger a significant bullish move.
Key Considerations:
Patterns are valuable tools, but they are not guarantees of future price action.
Always use additional indicators and fundamental analysis to confirm your trading decisions.
Risk management is crucial; set stop-loss orders to protect your investments.
Conclusion:
The falling wedge pattern in APT presents an intriguing opportunity for traders and investors. While patterns can offer insights, it's essential to combine them with a comprehensive analysis of market conditions and news events.
Keep a watchful eye on APT as it approaches the upper trendline of the falling wedge pattern. If the price can break through this resistance level, it may signify a bullish reversal and potential opportunities for growth.
Remember that cryptocurrency markets are inherently volatile, and trading involves risk. Exercise caution, do your research, and stay informed about APT's developments in the crypto space.
As the market unfolds, APT's falling wedge pattern could be the key to unlocking its true potential. Stay tuned for further updates and price action, and always trade responsibly.
❗See related ideas below❗
Like, share, and leave your thoughts in the comments! Your engagement fuels our crypto discussions. 💚🚀💚

apt finally getting ready for massive bullish rally already in uptrend and consolidating in daily timeframe seems like now consolidation getting closer to breakout incase of breakout expecting massive bullish rally towards 25$ in coming months
keep eyes on apt for confirmed breakout and do not trade without breakout

Aptos APTUSDT Price Analysis (1d)APTUSDT Price Analysis:
Aptos Token BINANCE:APTUSDT is currently displaying a descending movement within a Wedge pattern, a renowned bullish reversal formation. The present outlook suggests an impending price rebound, primarily from the Support zone positioned around the $4.0 level. Subsequently, we anticipate multiple price rebounds, ultimately culminating in a breakthrough of the Wedge's resistance.
The question arises: Can we attain our targets at $6.7 - 7.8? The answer lies in time's revelation.
Stay tuned for further updates as the market unfolds its story. 📈🕒

🔥MAV and APT: SAME PATTERN, SAME PROFIT❓Both altcoins fell by -60-70% after the Binance listing and reached the accumulation area.
💥 what's next? I think you understand.
Such fresh altcoins as Aptos, Render etc. are growing very easy and we make a profit on it, but every altcoin(!) depend on Bitcoin. Let's see what's daddy have for us during the upcoming days.

🔥SUI VS APT: This Pattern Works On ALL Fresh🔋 AltcoinsSui Network is the new altcoin on Binance which has an unlimited potential.
Now the price fell by -72% and consolidating inside green area. Additional bullish signal is a potential close above $0.45 key level.
The closest worthwhile target is at $1-1.25 (+170-200%). If BTC will close above 31-34k and continue its growth, SUI can easilly grow by 4-10-50x on a bull market.
💥$300M cap can easily turn into $1B or eve more how it was with Aptos.
like❤️ and follow
Check the links and get a BONUS🎁 from me👇

Be friendly with the process
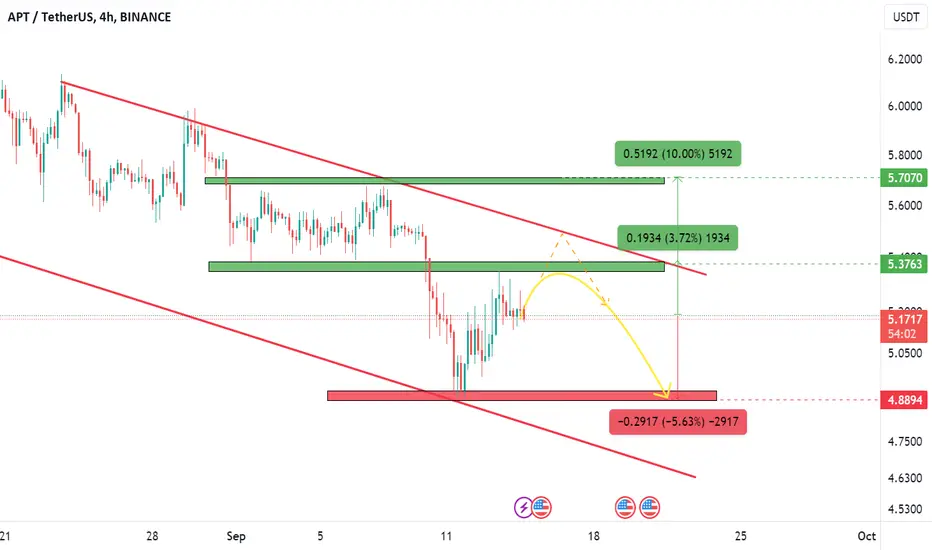
🟥 Support range: 4.8894
🔴 amount of shedding: -5%
🟩 First resistance range 5.3763
4% growth rate
🟩 Second resistance range 5.7070
Growth amount: 10%+
📊 The possibility of a 4% growth for this currency is stronger up to the first resistance range.
In case of failure of this range, there is a possibility of growth up to the ceiling of the channel, in case of failure of the first resistance, the analysis should be updated because it is important to check the strength of the failure.
APT Aptos Price Target after Court approves FTX LiquidationGiven the recent developments in the crypto space, there are several factors that point towards a bearish outlook:
FTX Liquidation of $3.4 Billion in Crypto Assets: The approval by the Delaware Bankruptcy Court for FTX to liquidate $3.4 billion in crypto assets is a significant event. This influx of a substantial amount of cryptocurrency into the market could potentially lead to an oversupply situation. When a large amount of assets is dumped into the market at once, it can put downward pressure on prices.
Limited Sales in the First Week: The imposed limit of $50 million for the first week indicates a controlled release of these assets. This may imply that FTX anticipates potential market disruption if a large volume is sold at once. However, even with controlled release, the market could still experience downward pressure.
Potential for Increased Limits: The provision for increasing the limit with the approval of the creditors’ committee and ad hoc committee, or potentially even up to $200 million weekly with court approval, shows that there's room for further selling pressure in the coming weeks.
Binance US CEO Resignation: The resignation of Binance US President and CEO, Brian Shroder, could potentially signal internal challenges within the exchange. Leadership changes in major crypto exchanges can lead to uncertainty and can impact market sentiment.
Asset List: The assets listed for liquidation include some of the major cryptocurrencies in the market such as Bitcoin, Ethereum, WBTC, WETH, USDT, SOL, XRP, STG, APT, BIT, DOGE, MATIC, FTT, TON and more. If a significant portion of these assets are sold off, it could have a widespread impact on the market.
Market Sentiment and Confidence: These events combined might lead to a loss of confidence in the crypto market, especially if investors perceive them as signs of instability or potential oversupply.
Regulatory Considerations: The fact that a bankruptcy court is involved in this process highlights the regulatory environment surrounding cryptocurrencies. Heightened regulatory scrutiny or intervention can have a dampening effect on the market.
Considering the above, my Price Target for APT Aptos is $3.10.
Looking forward to read your opinion about it.

APT/USDT decending channel breakout? 👀 🚀 Aptos Today AnalysisParadisers, pay attention! We're spotting a thrilling opportunity with APUSDT, which is currently holding a vital demand level and looks poised for a bullish surge👀
💎 The price of APT has recently indicated that the 5.0185 level serves as a key support and demand zone, potentially fueled by aggressive buying activity.
💎 Should the price break past this demand level, we could see a reversal aiming for the 4.0874 level, which is another crucial turning point.
💎 Moreover, if the price of Aptos successfully breaks out of the descending channel in an upward direction, it could present a lucrative trading opportunity.
Keep your charts updated and Stay one step ahead of the market 🌟 🌴

Aptos the Next Big One?A good project, same as SUI, but with their minor problems, the same as all other Layer 1's.
The major issue is the November Token Unlock.
What to do?
- Buy if APT reaches around 3.3$ and from there, start to DCA all the way down till 1.7$.
- In case it doesn't stabilise and the Market Makers don't pump it before november, we'll see sub 2$ for APT.
- Start to buy now, around 5.2$ and pray it doesn't go much more down. In any case, have extra cash to DCA.
Pros:
- APT is a top project for next cycle, vesting is the only problem they have right now, in this uncertain market.
- It will x20-x40 when the bullrun comes, it's almost a certainty. New project, new tech, new ideas. Old chains are gonna do x10-x15 but the projects that appeared during the last year, tend to make the biggest gains when the liquidity enters the market.
Cheers )

$APT targeting $48-50?AMEX:APT broke out of it's downtrend line in July and has since retested the structure. It looks primed for a move up.
Think we can see between $48-50 on the next move higher.

APTUSD 29/08 MovePair : APTUSD
Description :
Symmetrical Triangle in Short Time Frame acting as an Correction after the Break of Structure
Currently in Consolidation Phase if it Breaks then Short can be Expected for Long Term

Will APT go lower again?Hi, how are you ? Today we want to have a review on APT.
After many ups and downs, from where I entered "Start of correction", this symbol has started to fall.
According to the time-price laws of the waves, we seem to be in a large and time-consuming diametric.
Upon further investigation, we found that we are now in wave e of this diametric and we expect to see the lower green box drop.
We also have a liquidity pool in the lower areas, which I have indicated with $$$. It is expected that this pool will be filled and the movement of the IFC will be balanced and we will reach the support of the green cadre.
For risk management, please don't forget stop loss and capital management
Comment if you have any questions
Thank You

