APT BUY...hello friends
Considering the support range we are in, we expect a short-term growth of this currency.
Be sure to observe capital management.
Be successful and profitable.
APT

APTUSDT 1WAPT ~ 1W
#APT Has finished with the rising wave 5,. This is an Elliot Wave pattern, and usually this will be followed by an ABC correction. if this really happens,. then this support block would be a good buying place for now.

APTOS Price Discovery in 2025?AMEX:APT update
After reaching the green demand zone and now nearing the ATH. I expect Aptos to finish the recent correction soon and find it's way to reach and surpass the ATH.
Breaking $5.7 is the new invalidation.
Passing $14.4 confirms targeting anew ATH.
#Aptos

The key is whether it can rise above 9.39
Hello, traders.
If you "Follow", you can always get new information quickly.
Please click "Boost" as well.
Have a nice day today.
-------------------------------------
(APTUSDT 1W chart)
It seems that the M-Signal indicator on the 1M chart has started to be created.
Accordingly, the 7.41-9.39 section is an important support and resistance section.
When it shows support in the 7.41-9.39 section, it is a time to buy.
-
In order to turn into an uptrend, the price must be received above the MS-Signal (M-Signal on the 1W chart) indicator.
Therefore, the key is whether it can receive support and rise near 9.39.
-
The high point boundary section is formed in the 12.06-14.50 section, so if it rises above this section, it is expected to create a new upward wave.
If it falls below 7.41, it is expected to enter the mid- to long-term investment area.
Therefore, if possible, I think it would be better to trade when the price is maintained above 7.41 and wait and see if it falls below 7.41.
-
(1M chart)
-
Thank you for reading to the end.
I hope you have a successful trade.
--------------------------------------------------
- Big picture
I used TradingView's INDEX chart to check the entire section of BTC.
(BTCUSD 12M chart)
Looking at the big picture, it seems to have been maintaining an upward trend following a pattern since 2015.
That is, it is a pattern that maintains a 3-year uptrend and faces a 1-year downtrend.
Accordingly, the uptrend is expected to continue until 2025.
-
(LOG chart)
As you can see from the LOG chart, the uptrend is decreasing.
Accordingly, the 46K-48K range is expected to be a very important support and resistance range from a long-term perspective.
Therefore, we expect that we will not see prices below 44K-48K in the future.
-
The Fibonacci ratio on the left is the Fibonacci ratio of the uptrend that started in 2015.
In other words, it is the Fibonacci ratio of the first wave of the uptrend.
The Fibonacci ratio on the right is the Fibonacci ratio of the uptrend that started in 2019.
Therefore, this Fibonacci ratio is expected to be used until 2026.
-
No matter what anyone says, the chart has already been created and is already moving.
How to view and respond to this is up to you.
When the ATH is updated, there are no support and resistance points, so the Fibonacci ratio can be used appropriately.
However, although the Fibonacci ratio is useful for chart analysis, it is ambiguous when used as support and resistance.
This is because the user must directly select the important selection points required to create Fibonacci.
Therefore, since it is expressed differently depending on how the user specifies the selection points, it can be useful for chart analysis, but it can be seen as ambiguous when used for trading strategies.
1st : 44234.54
2nd : 61383.23
3rd : 89126.41
101875.70-106275.10 (Overshooting)
4th : 134018.28
151166.97-157451.83 (Overshooting)
5th : 178910.15
-----------------

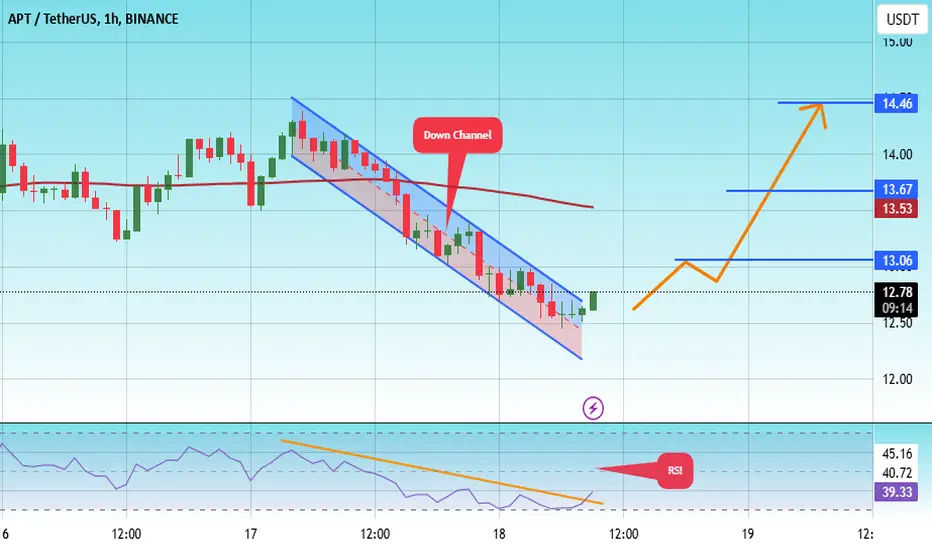
#APT/USDT Ready to go higher#APT
The price is moving in a descending channel on the 1-hour frame and sticking to it well
We have a bounce from the lower limit of the descending channel, this support is at 15.50
We have a downtrend on the RSI indicator that is about to be broken, which supports the rise
We have a trend to stabilize above the 100 moving average
Entry price 12.77
First target 13.06
Second target 13.76
Third target 14.46
APT/USDT )(APT)📈 Buy Signal for APT/USDT
✅ Suggestion: This is a market buy signal, and you can buy now.
🎯 Growth Expectation: I anticipate a 6% to 10% increase in the spot market.
📊 The labeled price targets will be reached soon. 🚀
💬 To manage this signal effectively and access even more opportunities:
1️⃣ Follow my TradingView page 📊
2️⃣ Send me a private message for further guidance.
💎 Let’s grow together and maximize profits! 💰

Aptus (Apt)Apt usdt Daily analysis
Time frame daily
Risk rewards ratio >2 👈👌
Target 17$
We have a resistance area in 17_18 $
So my target is 17$ and I guess price will move up and down between 17 and 18 $ then will star to upper target 23$

APTAPT / USDT
Recent nasty dump is fully absorbed in just few hours
it looks like the price is heading toward this massive range high (18$- 20$ area )
After that IF market conditions remains good #APT could fly harder than you think
Lets see

Not yet APT, not yetUnlike its successful cousin SUI, it seems APT needs to take longer to consolidate for any strong upward movement, watch the triangle


APT/USDT Trading ScenarioIn a persistently optimistic market environment, APT has shown a strong increase of over 250% from its local low, reaching $15.3.
Despite a sharp correction, the asset’s growth potential remains significant. Volume profile analysis indicates steady interest from market participants within the current price range. The asset is currently trading near the Point of Control (POC), a strong support zone, making it an attractive buying opportunity for anticipating a continuation of the upward trend.

APT plan Im expecting a pullback of APT in orange zone where I will do spot buy. Do not trade in leverage right now. I expect btc to go lower at the moment.

#APT/USDT Ready to go higher#APT
The price is moving in a descending channel on the 1-hour frame and sticking to it well
We have a bounce from the lower limit of the descending channel, this support is at 13.20
We have a downtrend on the RSI indicator that is about to break, which supports the rise
We have a trend to stabilize above the moving average 100
Entry price 13.52
First target 14.07
Second target 14.48
Third target 14.94

APTUSDT - Real project ... Potential targets!APT is one of the important coins in layer1 Network with (7.65B marketcap)
if u want to triple ur capital then buy APT!
- Strong project
- Ranked 25 in marketcap
- displays a Cup and Handle pattern in weekly chart
- Hasn't moved strongly yet
Best regards Ceciliones🎯

APTUSDT is more likely to brake the resistance this timeusr 5% of your capital
confidence intrade - medium
risk/reward is good
this is not a financial advoice , just for educationl purposes

Alikze »» APT | Forming a head and shoulders pattern - 2D🔍 Technical analysis: Forming a head and shoulders pattern
- It is moving in an ascending channel in the daily time frame.
- After the touch neck line and also the failure of swing and poleback to it, it has continued its growth up to the ceiling of the channel.
- Currently, an AB=CD pattern is formed.
- In addition, a head and shoulder pattern is also observed in the daily and weekly time frames.
- Therefore, it can have another growth in the middle of the channel after a temporary correction, up to the area of the width and roof of the channel.
💎In addition, it can continue its growth until the next supply zone after the failure of the supply zone and pullback to it.
🚨 Note: The support area of 6.25 is the validity area of the analysis, if the candlestick stabilizes below the area, the bullish pattern will be invalidated. 🚨
»»»«««»»»«««»»»«««
Please support this idea with a LIKE and COMMENT if you find it useful and Click "Follow" on our profile if you'd like these trade ideas delivered straight to your email in the future.
Thanks for your continued support.
Best Regards,❤️
Alikze.
»»»«««»»»«««»»»«««
BINANCE:APTUSDT

APTUSDT LONG AGAIN AFTER LAST FULL TP.APTUSDT is bullish and you have seen in our last APTUSDT trade that we have made full TP. And now I have found another great setup on this chart. Demand zone is below the sell side liquidity, when price will come down to fill FVG and grab that liquidity then we will enter LONG in this demand zone.

#APT/USDT Ready to go higher#APT
The price is moving in a descending channel on a 15-minute frame and sticking to it well
We have a bounce from the lower limit of the descending channel, this support is at 13.00
We have a downtrend on the RSI indicator that is about to be broken, which supports the rise
We have a trend to stabilize above the moving average 100
Entry price 13.40
First target 13.73
Second target 14.19
Third target 14.62

PerpotentialHello friends
APT entered TR after a good trend and with its failure we expect good growth from it.
We have specified its targets in the picture for you if the range is maintained and the price increases.
Don't forget capital management.
GOOD LUCK

APTUSDT TAKE PROFIT DONE.APTUSDT yesterday chart was shared and today entry filled and full TP done.

#APT/USDT Ready to go higher#APT
The price is moving in a descending channel on the 30-minute frame and sticking to it well
We have a bounce from the lower limit of the descending channel, this support is at a price of 12.33
We have a downtrend on the RSI indicator that is about to be broken, which supports the rise
We have a trend to stabilize above the moving average 100
Entry price 12.80
First target 13.18
Second target 13.57
Third target 13.96

#APT/USDT
#APT
We have a trend to stabilize above the moving average 100 again.
We have a downtrend on the RSI indicator that supports the rise by breaking it upwards.
We have a support area at the lower limit of the channel at a price of
11.00
Entry price 11.50
First target 12.42
Second target 13.07
Third target 13.89

$APT TIME TO RETRACEIn 10 hours, APT has gone up +45%.
I believe it is due for a pullback.
Under $10.50 we should see more downside.
