#APT/USDT Buyers Need To Establish Support Zone#APT
The price is moving within an ascending channel on the 1-hour frame, adhering well to it, and is on its way to break strongly upwards and retest it.
We have support from the lower boundary of the ascending channel, at 4.10.
We have a downtrend on the RSI indicator that is about to break and retest, supporting the upside.
There is a major support area in green at 4.05, which represents a strong basis for the upside.
Don't forget a simple thing: ease and capital.
When you reach the first target, save some money and then change your stop-loss order to an entry order.
For inquiries, please leave a comment.
We have a trend to hold above the Moving Average 100.
Entry price: 4.25.
First target: 4.35.
Second target: 4.46.
Third target: 4.05.
Don't forget a simple thing: ease and capital.
When you reach the first target, save some money and then change your stop-loss order to an entry order.
For inquiries, please leave a comment.
Thank you.
APTBTC

#APT/USDT#APT
The price is moving within an ascending channel on the 1-hour frame, adhering well to it, and is on track to break it strongly upwards and retest it.
We have support from the lower boundary of the ascending channel, at 0.1560.
We have a bearish trend on the RSI indicator that is about to break and retest, supporting the upside.
There is a major support area in green at 0.1555, which represents a strong basis for the upside.
Don't forget a simple thing: ease and capital.
When you reach the first target, save some money and then change your stop-loss order to an entry order.
For inquiries, please leave a comment.
We have a trend to hold above the 100 Moving Average.
Entry price: 0.1600
First target: 0.1640
Second target: 0.1677
Third target: 0.1719
Don't forget a simple thing: ease and capital.
When you reach your first target, save some money and then change your stop-loss order to an entry order.
For inquiries, please leave a comment.
Thank you.
APT : Long term purchaseHello friends🙌
👀You see that the price is in a range and now we are at the bottom of the range. The scenario is simple. The bottom of the range is a good buying opportunity that can be used because 80% of the failures in the range are fake.
⚠So we can buy with risk and capital management and move with it to the specified targets.
🔥Follow us for more signals🔥
*Trade safely with us*

APT : Did the buyers arrive?Hello friends🙌
📈An ascending channel and then a descending channel and then an ascending channel.📉
✔The point is that when the price entered an ascending channel, your price entered and with a failure it entered a descending channel and you exited with a loss and again when the price is at the peak of despair you see that the main buyers enter and push the price up and cause a new ascending channel.
🔊Considering these tips we have told you, always have a trading plan and follow capital management so that you do not fall into the trap.
🔥Follow us for more signals🔥
*Trade safely with us*

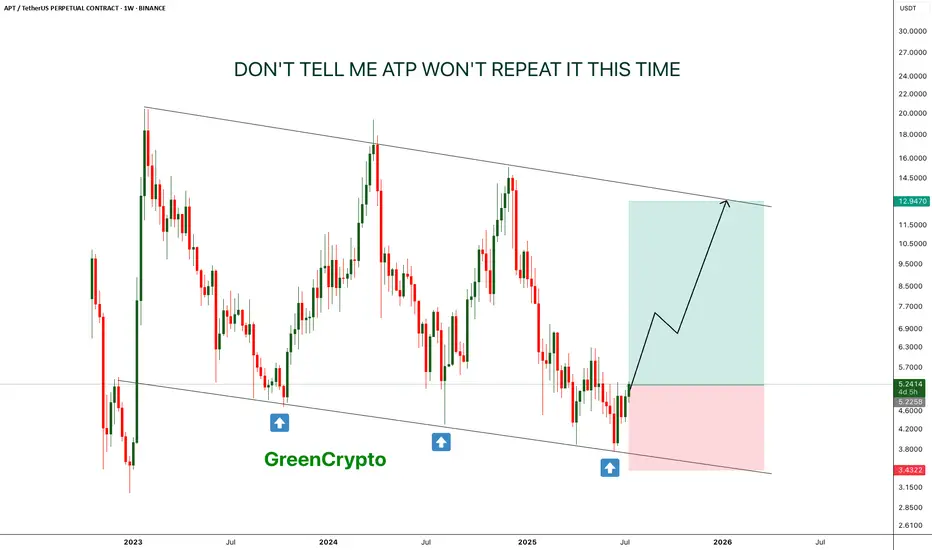
APT - Don't tell me this pattern won't repeat- This time is the charm, APT is is reversing from lower low on weekly chart.
- just like last two time, it is expect to forma new HL.
- there is a high chance that previous two patterns will repeat again
Entry Price: 5.22
Stop Loss: 3.4
TP1: 6.6632
TP2: 8.5059
TP3: 12.6945
Max Leverage: 5x
Don't forget to keep stoploss
Cheers
GreenCrypto
#APT/USDT#APT
The price is moving within a descending channel on the 1-hour frame, adhering well to it, and is on its way to breaking it strongly upwards and retesting it.
We have a bounce from the lower boundary of the descending channel. This support is at 4.43.
We have a downtrend on the RSI indicator that is about to be broken and retested, supporting the upside.
There is a major support area in green at 4.35, which represents a strong basis for the upside.
Don't forget a simple thing: ease and capital.
When you reach the first target, save some money and then change your stop-loss order to an entry order.
For inquiries, please leave a comment.
We have a trend to hold above the 100 Moving Average.
Entry price: 4.47
First target: 4.50
Second target: 4.54
Third target: 4.60
Don't forget a simple thing: ease and capital.
When you reach the first target, save some money and then change your stop-loss order to an entry order.
For inquiries, please leave a comment.
Thank you.

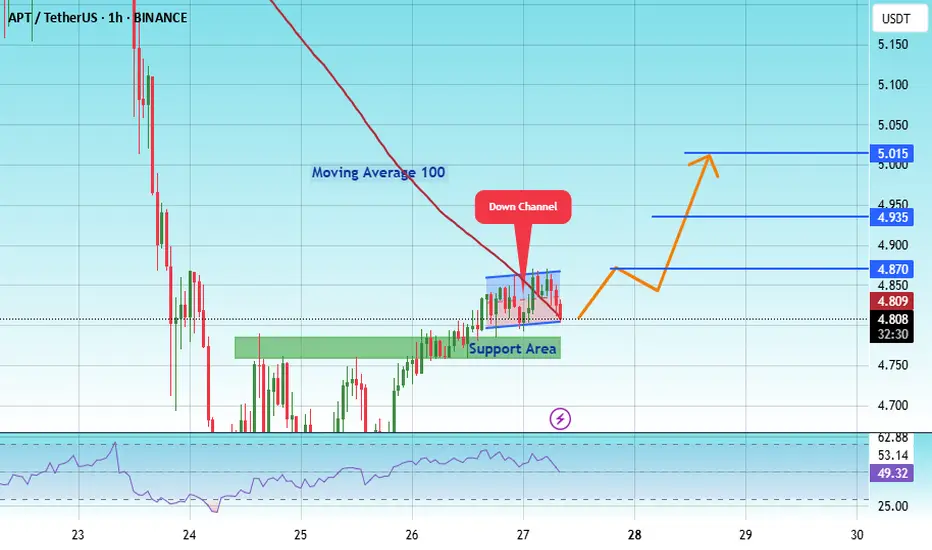
APT at 4.78 $ Historic Support – Massive Reversal Incoming?#APT
The price is moving within a descending channel on the 1-hour frame and is expected to break and continue upward.
We have a trend to stabilize above the 100 moving average once again.
We have a downtrend on the RSI indicator that supports the upward break.
We have a support area at the lower boundary of the channel at 4.78, acting as strong support from which the price can rebound.
We have a major support area in green that pushed the price higher at 4.60.
Entry price: 4.88
First target: 5.047
Second target: 5.19
Third target: 5.35
To manage risk, don't forget stop loss and capital management.
When you reach the first target, save some profits and then change your stop order to an entry order.
For inquiries, please comment.
Thank you.

#APT/USDT#APT
The price is moving within a descending channel on the 1-hour frame and is expected to break and continue upward.
We have a trend to stabilize above the 100 moving average once again.
We have a downtrend on the RSI indicator that supports the upward move with a breakout.
We have a support area at the lower boundary of the channel at 3.81, acting as strong support from which the price can rebound.
Entry price: 4.03
First target: 4.16
Second target: 4.30
Third target: 4.59

#APT/USDT#APT
The price is moving within a descending channel on the 1-hour frame, adhering well to it, and is heading towards a strong breakout and retest.
We are experiencing a rebound from the lower boundary of the descending channel, which is support at 4.87.
We are experiencing a downtrend on the RSI indicator that is about to be broken and retested, supporting the upward trend.
We are heading towards stability above the 100 Moving Average.
Entry price: 4.92
First target: 4.95
Second target: 5.02
Third target: 5.10

APTOS $APTI don't think I need to explain what APTOS is here.
Right now, it's a good point for a swing position, which is why you're seeing this post.
Best regards EXCAVO

#APT/USDT#APT
The price is moving within a descending channel on the 1-hour frame and is expected to break and continue upward.
We have a trend to stabilize above the 100 moving average once again.
We have a downtrend on the RSI indicator that supports the upward move with a breakout.
We have a support area at the lower limit of the channel at 5.50, acting as strong support from which the price can rebound.
Entry price: 5.70
First target: 5.82
Second target: 6.00
Third target: 6.17

#APT/USDT#APT
The price is moving within a descending channel on the 1-hour frame, adhering well to it, and is heading for a strong breakout and retest.
We are experiencing a rebound from the lower boundary of the descending channel, which is support at 4.95.
We are experiencing a downtrend on the RSI indicator that is about to be broken and retested, supporting the upward trend.
We are looking for stability above the 100 Moving Average.
Entry price: 5.22
First target: 5.34
Second target: 5.47
Third target: 5.65

#APT/USDT#APT
The price is moving within a descending channel on the 1-hour frame, adhering well to it, and is heading for a strong breakout and retest.
We are seeing a bounce from the lower boundary of the descending channel, which is support at 4.60.
We have a downtrend on the RSI indicator that is about to break and retest, supporting the upward trend.
We are looking for stability above the 100 Moving Average.
Entry price: 4.76
First target: 4.88
Second target: 5.03
Third target: 5.23

APTUSDT - the real monster!APT has reached its strongest support level ever.
You’ll notice that price always tends to bounce from this exact zone.
This coin hasn’t moved yet, and its long-term targets are insane — definitely worth having a portion of it in your portfolio
Best regards Cecilion🎯

#APT/USDT
#APT
The price is moving within a descending channel on the 1-hour frame, adhering well to it, and is heading for a strong breakout and retest.
We are experiencing a rebound from the lower boundary of the descending channel, which is support at 4.75.
We are experiencing a downtrend on the RSI indicator that is about to be broken and retested, supporting the upward trend.
We are looking for stability above the 100 Moving Average.
Entry price: 4.95
First target: 5.06
Second target: 5.17
Third target: 5.28

APT BUYHello friends
Due to the price increase, you can now see that the price is correcting, so we have identified good support levels for you to buy in steps and with capital management and targets.
*Trade safely with us*

#APT/USDT#APT
The price is moving within a descending channel on the 1-hour frame, adhering well to it, and is heading toward a strong breakout and retest.
We are experiencing a rebound from the lower boundary of the descending channel, which is support at 4.50.
We are experiencing a downtrend on the RSI indicator, which is about to break and retest, supporting the upward trend.
We are heading toward stability above the 100 Moving Average.
Entry price: 4.55
First target: 4.65
Second target: 4.74
Third target: 4.86

#APT/USDT#APT
The price is moving within a descending channel on the 1-hour frame and is expected to continue upward.
We have a trend to stabilize above the 100 moving average once again.
We have a downtrend on the RSI indicator, supporting the upward move with a breakout.
We have a support area at the lower boundary of the channel at 5.20.
Entry price: 5.41
First target: 5.46
Second target: 5.58
Third target: 5.70

#APT/USDT#APT
The price is moving within a descending channel on the 1-hour frame and is expected to continue lower.
We have a trend to stabilize below the 100 moving average once again.
We have a downtrend on the RSI indicator, supporting the upward move with a break above it.
We have a resistance area at the upper limit of the channel at 5.43.
Entry price: 5.32
First target: 5.28
Second target: 5.21
Third target: 5.10

#APT/USDT
#APT
The price is moving within a descending channel on the 1-hour frame, adhering well to it, and is heading for a strong breakout and retest.
We are experiencing a rebound from the lower boundary of the descending channel, which is support at 5.45.
We are experiencing a downtrend on the RSI indicator that is about to break and retest, supporting the upward trend.
We are looking for stability above the 100 Moving Average.
Entry price: 5.45
First target: 5.55
Second target: 5.66
Third target: 5.80

#APT/USDT#APT
The price is moving in a descending channel on the 1-hour frame and is adhering to it well and is heading to break it strongly upwards and retest it
We have a bounce from the lower limit of the descending channel, this support is at a price of 5.74
We have a downtrend on the RSI indicator that is about to break and retest, which supports the rise
We have a trend to stabilize above the Moving Average 100
Entry price 5.94
First target 6.076
Second target 6.27
Third target 6.48

#APT/USDT#APT
The price is moving in a descending channel on the 1-hour frame and is adhering to it well and is heading to break it upwards strongly and retest it
We have a bounce from the lower limit of the descending channel, this support is at a price of 2.36
We have a downtrend on the RSI indicator that is about to break and retest, which supports the rise
We have a trend to stabilize above the Moving Average 100
Entry price 5.44
First target 5.72
Second target 5.96
Third target 6.20

#APT/USDT#APT
The price is moving in a descending channel on the 1-hour frame and is adhering to it well and is heading to break it strongly upwards and retest it
We have a bounce from the lower limit of the descending channel, this support is at a price of 5.67
We have a downtrend on the RSI indicator that is about to break and retest, which supports the rise
We have a trend to stabilize above the Moving Average 100
Entry price 5.74
First target 5.87
Second target 6.03
Third target 6.26
