APTUSDT Analysis: Waiting for Lower LevelsI see no reason not to wait for lower levels in APTUSDT. The market conditions suggest that there might be a better opportunity for entries at these levels.
Key Points:
Lower Levels: Waiting for lower levels might provide better risk/reward setups.
Market Conditions: Keep in mind that market conditions can change quickly, so stay cautious.
Confirmation Indicators: Use CDV, liquidity heatmaps, volume profiles, volume footprints , and upward market structure breaks in lower time frames for validation.
Learn With Me: If you're interested in learning how to use these tools for accurate demand zone identification, feel free to DM me.
If this analysis helps you, please don’t forget to boost and comment. Your support motivates me to share more insights!
If you think this analysis helps you, please don't forget to boost and comment on this. These motivate me to share more insights with you!
I keep my charts clean and simple because I believe clarity leads to better decisions.
My approach is built on years of experience and a solid track record. I don’t claim to know it all, but I’m confident in my ability to spot high-probability setups.
If you would like to learn how to use the heatmap, cumulative volume delta and volume footprint techniques that I use below to determine very accurate demand regions, you can send me a private message. I help anyone who wants it completely free of charge.
My Previous Analysis
🎯 ZENUSDT.P: Patience & Profitability | %230 Reaction from the Sniper Entry
🐶 DOGEUSDT.P: Next Move
🎨 RENDERUSDT.P: Opportunity of the Month
💎 ETHUSDT.P: Where to Retrace
🟢 BNBUSDT.P: Potential Surge
📊 BTC Dominance: Reaction Zone
🌊 WAVESUSDT.P: Demand Zone Potential
🟣 UNIUSDT.P: Long-Term Trade
🔵 XRPUSDT.P: Entry Zones
🔗 LINKUSDT.P: Follow The River
📈 BTCUSDT.P: Two Key Demand Zones
🟩 POLUSDT: Bullish Momentum
🌟 PENDLEUSDT.P: Where Opportunity Meets Precision
🔥 BTCUSDT.P: Liquidation of Highly Leveraged Longs
🌊 SOLUSDT.P: SOL's Dip - Your Opportunity
🐸 1000PEPEUSDT.P: Prime Bounce Zone Unlocked
🚀 ETHUSDT.P: Set to Explode - Don't Miss This Game Changer
🤖 IQUSDT: Smart Plan
⚡️ PONDUSDT: A Trade Not Taken Is Better Than a Losing One
💼 STMXUSDT: 2 Buying Areas
🐢 TURBOUSDT: Buy Zones and Buyer Presence
🌍 ICPUSDT.P: Massive Upside Potential | Check the Trade Update For Seeing Results
🟠 IDEXUSDT: Spot Buy Area | %26 Profit if You Trade with MSB
📌 USUALUSDT: Buyers Are Active + %70 Profit in Total
🌟 FORTHUSDT: Sniper Entry +%26 Reaction
🐳 QKCUSDT: Sniper Entry +%57 Reaction
📊 BTC.D: Retest of Key Area Highly Likely
I stopped adding to the list because it's kinda tiring to add 5-10 charts in every move but you can check my profile and see that it goes on..
APTBTC

#APT/USDT#APT
The price is moving in a descending channel on the 1-hour frame and is adhering to it well and is heading to break it strongly upwards and retest it
We have a bounce from the lower limit of the descending channel, this support is at a price of 5.85
We have a downtrend on the RSI indicator that is about to break and retest, which supports the rise
We have a trend to stabilize above the Moving Average 100
Entry price 6.13
First target 6.62
Second target 6.91
Third target 7.31

#APT/USDT Ready to launch upwards#APT
The price is moving in a descending channel on the 1-hour frame and is adhering to it well and is heading to break it strongly upwards
We have a bounce from the lower limit of the descending channel, this support is at a price of 7.20
We have a downtrend on the RSI indicator that is about to be broken, which supports the rise
We have a trend to stabilize above the moving average 100
Entry price 7.54
First target 7.84
Second target 8.17
Third target 8.50

#APT/USDT Ready to go higher#APT
The price is moving in a descending channel on the 1-hour frame and sticking to it well
We have a bounce from the lower limit of the descending channel, this support is at a price of 4.20
We have a downtrend on the RSI indicator that is about to be broken, which supports the rise
We have a trend to stabilize above the moving average 100
Entry price 8.23
First target 8.58
Second target 8.82
Third target 9.08

#APT/USDT#APT
The price is moving in a descending channel on the 1-hour frame and is expected to continue upwards
We have a trend to stabilize above the moving average 100 again
We have a descending trend on the RSI indicator that supports the rise by breaking it upwards
We have a support area at the lower limit of the channel at a price of 8.40
Entry price 8.58
First target 8.87
Second target 9.27
Third target 9.61

#APT/USDT Ready to go higher#APT
The price is moving in a descending channel on the 1-hour frame and sticking to it well
We have a bounce from the lower limit of the descending channel, this support is at 15.50
We have a downtrend on the RSI indicator that is about to be broken, which supports the rise
We have a trend to stabilize above the 100 moving average
Entry price 12.77
First target 13.06
Second target 13.76
Third target 14.46
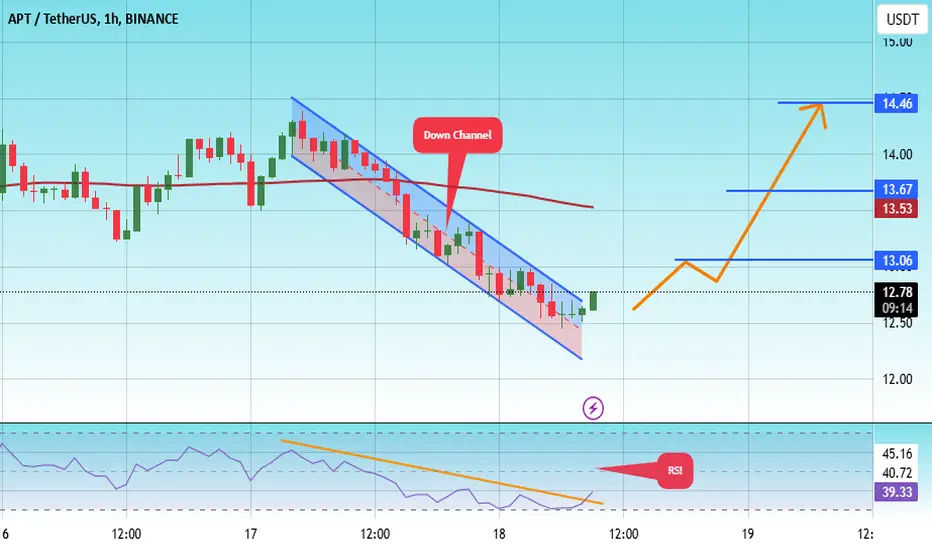
APT plan Im expecting a pullback of APT in orange zone where I will do spot buy. Do not trade in leverage right now. I expect btc to go lower at the moment.

#APT/USDT Ready to go higher#APT
The price is moving in a descending channel on the 1-hour frame and sticking to it well
We have a bounce from the lower limit of the descending channel, this support is at 13.20
We have a downtrend on the RSI indicator that is about to break, which supports the rise
We have a trend to stabilize above the moving average 100
Entry price 13.52
First target 14.07
Second target 14.48
Third target 14.94

APTUSDT - Real project ... Potential targets!APT is one of the important coins in layer1 Network with (7.65B marketcap)
if u want to triple ur capital then buy APT!
- Strong project
- Ranked 25 in marketcap
- displays a Cup and Handle pattern in weekly chart
- Hasn't moved strongly yet
Best regards Ceciliones🎯

#APT/USDT Ready to go higher#APT
The price is moving in a descending channel on a 15-minute frame and sticking to it well
We have a bounce from the lower limit of the descending channel, this support is at 13.00
We have a downtrend on the RSI indicator that is about to be broken, which supports the rise
We have a trend to stabilize above the moving average 100
Entry price 13.40
First target 13.73
Second target 14.19
Third target 14.62

#APT/USDT Ready to go higher#APT
The price is moving in a descending channel on the 30-minute frame and sticking to it well
We have a bounce from the lower limit of the descending channel, this support is at a price of 12.33
We have a downtrend on the RSI indicator that is about to be broken, which supports the rise
We have a trend to stabilize above the moving average 100
Entry price 12.80
First target 13.18
Second target 13.57
Third target 13.96

TradeCityPro | APTUSDT Bullish Correction & Continuation👋 Welcome to the TradeCityPro channel!
Let's start the week by analyzing APTUSDT, one of the altcoins with a promising setup.
📊 Bitcoin Overview
At the New York market open, Bitcoin has printed a few green candles , Meanwhile, BTC dominance (BTC.D) has been declining, breathing new life into altcoins.
As long as BTC.D continues to drop, altcoins will likely remain active and bullish.
🕒 Weekly Timeframe
APTUSDT has been trading in a long-term range box for nearly 700 days, fluctuating within it since its listing.
Unlike many other altcoins, APTUSDT has never dropped to its final support at $3.45, instead finding consistent support at $5.50–$5.77, giving it an edge over its peers.
Currently, there's no weekly trigger for buying , bounce of the RSI from 70 could signal the continuation of its upward momentum.
🚀 Daily Timeframe
APTUSDT has rallied beautifully from $5.67 support, reaching resistance at $13.66, where it was rejected. After consolidating for a few days, it is now moving back toward that resistance.
The chart shows a parabolic uptrend, with higher highs and higher lows forming consistently , Each time the price touches this parabolic trendline, it bounces upward, suggesting this structure might persist.
break of the parabola would likely signal a short-term correction, not necessarily a bearish market reversal.
For a buy, wait for a breakout above $13.66 with increased volume and RSI entering overbought territory. & Suggested stop-loss Risky: $10.50 - Safer: $7.51
If the market corrects, look for a bounce at $10.50 support with a confirming bullish candle for a mid-term hold.
⏳ 4H Timeframe
APTUSDT has been ranging between $11.22 and $13.78 for a few days, making the triggers clear for trading.
📈 Long Position Trigger
breakout above $13.78 would provide a strong trigger for a long position. You can even set a stop-buy order before the breakout.
📉 Short Position Trigger
Avoid shorting as the overall market setup remains bullish. Instead, focus on other opportunities like DeFi or researching promising projects :))
💡 BTC Pair Insight
Against Bitcoin, APTUSDT shares a similar setup to other altcoins, consolidating in its range.
breakout above 0.0001624 BTC could signal fresh inflows into APTUSDT and spark a bullish movement.
📝 Final Thoughts
Stay calm, trade wisely, and let's capture the market's best opportunities!
This analysis reflects our opinions and is not financial advice.
Share your thoughts in the comments, and don’t forget to share this analysis with your friends! ❤️

#APT/USDT
#APT
We have a trend to stabilize above the moving average 100 again.
We have a downtrend on the RSI indicator that supports the rise by breaking it upwards.
We have a support area at the lower limit of the channel at a price of
11.00
Entry price 11.50
First target 12.42
Second target 13.07
Third target 13.89

Aptos (APT) Among all those red candles and McDonald's chart patterns still altcoins and new projects in crypto rise and pumping each and every single day
Aptos price today is $9 with a 24-hour trading volume of half a billion. APT price is up 23.0% in the last 24 hours. It has a circulating supply of 130 Million APT coins and a total supply of 1 billion
but let see what is this project at all, Aptos is a new, independent high performance PoS Layer one project focused on delivering the safest and most scalable Layer 1 blockchain in the world. The Aptos blockchain leverages the Move programming language and the Move VM for application development, which are created and optimized for blockchain use cases.The team is comprised of the original creators, researchers, designers, and builders of Diem, the blockchain that was first built to serve this purpose. Aptos raised $200 million from a16z, Multicoin, Binance and others. Aptos launched Devnet in mid March, incentivized testnet in late May and targets Q3 for mainnet launch. you can check their whitepaper for more details too.
one thing you should remember in bear market is, always take a profit
tg 9.1 , 9.5 , 9.9

APT buy/long setup (1D)It seems that a correction wave has ended.
A tigger line is also broken.
Now we have a POI range on the chart which is our rebuy range
The targets are clear on the chart.
Closing a daily candle below the invalidation level will violate the analysis.
For risk management, please don't forget stop loss and capital management
When we reach the first target, save some profit and then change the stop to entry
Comment if you have any questions
Thank You

#APT/USDT Ready to go up#APT
The price is moving in a descending channel on the 1-hour frame and sticking to it well
We have a bounce from the lower limit of the descending channel, this support is at 0.07342
We have a downtrend, the RSI indicator is about to break, which supports the rise
We have a trend to stabilize above the 100 moving average
Entry price 11.77
First target 12.52
Second target 13.20
Third target 14.02

#APT/USDT#APT
The price is moving in a descending channel on the 4-hour frame upwards and is expected to continue.
We have a trend to stabilize above the moving average 100 again.
We have a descending trend on the RSI indicator that supports the rise by breaking it upwards.
We have a support area at the lower limit of the channel at a price of 8.50.
Entry price 9.10.
First target 9.70.
Second target 10.40.
Third target 11.06.

APT Short📈 Current Price and Trend:
The chart shows that APTUSDT is trading around $9.12.
A bullish trend started from a strong support level, as marked with the annotation "Start Latest bull-trend". The price has moved upwards within a channel, breaking through previous resistance levels.
🔄 Pullback to Breakeven:
A pullback to the breakeven zone (highlighted in red) around $9.57 - $9.97 is seen, which may act as a key resistance area if the price attempts to rise again.
🎯 Take Profit Targets (TP):
TP-1: $9.18 📌 – This level might be a short-term resistance where partial profit can be considered.
TP-2: $8.83 📉 – Another potential target within a downward trend.
TP-3: $8.30 📉 – This level aligns with the next support, where a significant pullback could happen.
📊 Key Support and Resistance:
Resistance: Near $10.73, marked by the upper trendline, and also around $9.57 - $9.97 (breakeven pullback zone).
Support: The next strong support level is around $7.49, where a trend reversal could occur if the price drops.
⚠️ Recommendation:
Long Position: Consider entry if the price holds above the breakeven zone with targets at TP-1, TP-2, and TP-3.
Short Position: If the price fails to hold above the breakeven zone, aiming for lower targets around $8.83 and $8.30 could be prudent.
This analysis combines key price levels, potential take-profits, and possible resistance and support zones as per the channel and trendlines shown.

#APT\USDT#APT
The price is moving in a descending channel on the 1-hour frame upwards and is expected to continue.
We have a trend to stabilize above the moving average 100 again.
We have a downtrend on the RSI indicator that supports the rise by breaking it upwards.
We have a support area at the lower limit of the channel at a price of 9.70.
Entry price 9.80.
First target 10.19.
Second target 10.50.
Third target 10.88.

APTUSDT Surges Above 100 and 200 EMAAPTUSDT technical analysis update
APT's price has crossed above the 100 and 200 EMA on the daily chart. It has now retested the 200 EMA and is bouncing back, having also broken through a major resistance zone. We can expect a strong bullish move in the coming days.
Regards
Hexa

#APT/USDT#APT
The price is moving in a descending channel on the 1-hour frame
And it is sticking to it well
We have a bounce from the lower limit of the descending channel and we are now touching this support at a price of 8.30
We have a downtrend on the RSI indicator that is about to be broken, which supports the rise
We have a trend to stabilize above the moving average 100
Entry price 8.37
First target 8.68
Second target 9.00
Third target 9.45

APT - The signal is crystal clear.#APT/USDT #Analysis
Description
---------------------------------------------------------------
+ APT has clearly bounced from the support zone, and we are now seeing a defined trend.
+ The price is moving towards the next resistance around $18.
+ This presents a clear opportunity to capitalize on the trend and maximize profits.
---------------------------------------------------------------
VectorAlgo Trade Details
------------------------------
Entry Price: 9.13
Stop Loss: 6.43
------------------------------
Target 1: 10.84
Target 2: 12.96
Target 3: 15.23
Target 4: 18.57
Target 5: 26.78
------------------------------
Timeframe:1W
Capital Risk: 1-2% of trading amount
Leverage: 5-10x
---------------------------------------------------------------
Enhance, Trade, Grow
---------------------------------------------------------------
Feel free to share your thoughts and insights.
Don't forget to like and follow us for more trading ideas and discussions.
Best Regards,
VectorAlgo

#APT/USDT#APT
The price is moving in a descending channel on the 4-hour frame and is sticking to it very well and is expected to break it upwards
We have a bounce from a major support area at the lower line of the channel at 5.60
We have a downtrend on the RSI indicator which supports the rise
We have a trend to stabilize above the 100 moving average
Entry price 5.60
First target 6.09
Second target 6.65
Third target 7.15
