#APT/USDT#APT
The price is moving within a descending channel on the 1-hour frame, adhering well to it, and is on its way to breaking it strongly upwards and retesting it.
We have a bounce from the lower boundary of the descending channel. This support is at 4.43.
We have a downtrend on the RSI indicator that is about to be broken and retested, supporting the upside.
There is a major support area in green at 4.35, which represents a strong basis for the upside.
Don't forget a simple thing: ease and capital.
When you reach the first target, save some money and then change your stop-loss order to an entry order.
For inquiries, please leave a comment.
We have a trend to hold above the 100 Moving Average.
Entry price: 4.47
First target: 4.50
Second target: 4.54
Third target: 4.60
Don't forget a simple thing: ease and capital.
When you reach the first target, save some money and then change your stop-loss order to an entry order.
For inquiries, please leave a comment.
Thank you.
Aptosanatysis

APT/USDT – Final Defense at Weekly Demand Zone! Prepare for MoveAPT is currently standing at a make-or-break level. Price has retraced back to the critical weekly demand zone between $4.00 and $4.40 — a region that previously served as the launchpad for a major rally in early 2023.
This isn't just any support — it’s a historical accumulation zone, where strong buying interest was previously observed. The big question is: Will history repeat itself, or is a major breakdown looming?
🔍 Pattern Structure and Technical Outlook:
APT has been consolidating inside a large horizontal range (accumulation box) between $4.00 and $18.27 for nearly two years.
Price is now retesting the lower boundary of this range, right at the $4.00–$4.40 zone.
Current price action shows heavy selling pressure, but buyers may step in at this demand level.
A potential double bottom or false breakdown could form if this week closes with a long lower wick and bullish body.
🟢 Bullish Scenario: Reversal from the Legendary Support
If the $4.00–$4.40 zone holds once again, we could witness a technical rebound with meaningful upside targets:
Key Bullish Targets:
1. $5.14 – Immediate minor resistance, easy to break if short-covering begins.
2. $5.86 – A key level previously rejected, acting as the first confirmation of trend reversal.
3. $7.63 – $9.00 – Former consolidation zone, potential mid-term target.
4. $10.18 to $14.51 – If momentum builds, this becomes the next major expansion zone.
> 📈 Positive catalysts such as improving crypto sentiment, strong volume inflow, or bullish fundamentals could accelerate this scenario.
🔴 Bearish Scenario: Critical Breakdown from Demand Structure
If sellers remain dominant and price closes below $4.00, this would:
Confirm a breakdown from the long-standing accumulation range
Open the door for a deeper retracement toward:
$3.50
$2.80
Possibly as low as the psychological level of $2.00
> ⚠️ Such a breakdown could indicate a major distribution phase and a loss of confidence from larger market players.
🧠 Suggested Trading Strategies:
Buy on Confirmation: Look for strong bullish reversal candles (hammer, pin bar, bullish engulfing) at the demand zone.
Breakout Strategy: Wait for a breakout and retest above $5.86–$7.63 for a safer entry.
Bearish Bias: Consider short entries on a confirmed breakdown and failed retest above $4.00.
📌 Conclusion:
APT is testing its final line of defense. The $4.00 zone remains the last stand for bulls before opening the door to deeper downside levels. Will buyers show strength once again, or are we headed for a major sell-off?
> This week’s close is crucial and could define APT’s trajectory for the upcoming quarter. Watch volume, candle structure, and buyer reaction very closely.
#APTUSDT #APTAnalysis #CryptoReversal #DemandZone #SupportAndResistance #PriceActionTrading #AltcoinSetup #TechnicalAnalysis #CryptoBreakout

Aptos Long Term ViewAptos taken out almost all liquidation from below side, it can fall more towards 3.5$ to take out all new buyers and then push towards 15$, remember 15-16$ is an unmitigated zone, sooner or later this imbalance zone will be filled. So if your an investor and want easy 3x gain then buy apt from 5$ 2nd entry 4$ and last buying from 3.5$, ignore lower timeframe volatility and BTC movement, these entries are easily achievable if market crashes by any chance so you can close your position at breakeven. While 7.19-7.50$ area is crucial to break, once this zone is broken there is nothing upside that can stop Aptos from hitting 15$. Any daily candle closing above the marked zone will confirm trend shift, before this trade setup is like high risk n reward. While I'm very confident on Aptos that it will hit 15% mark.

APT around a historical support DO or DIEAPT / USDT
Price dropped hard to retest the massive historical support again
This multi years support ( 3$-4$) zone always shows great buying pressures thats why it catch our attention!
This support also can play as DO or DIE borderline between bulls and bears
The buyers must defend this area otherwise it will die and make new lows
Keep an eye on it

Aptos scalp n swing trade setupAptos is facing daily Order Block resistance , While on Weekly clearly showing to take out the previous high 15-16$, It's a weekly TF so it will take time. On a day trade you can take long position from the mentioned zone, while in upcoming days it's gonna hit 7.42$ at least to fill the imbalance even if it's a bear market. If any 1hr candle closes below the mentioned zone then it will take correction for short term of period then it will take flight to towards the 15-16$. If you are investor then accumulate between 4.5-5$ and set tp and forget it. If you wanna take the long position then take it from the mentioned zone if candle closes below the zone then wait for the retest and close on breakeven.

APTUSDT - the real monster!APT has reached its strongest support level ever.
You’ll notice that price always tends to bounce from this exact zone.
This coin hasn’t moved yet, and its long-term targets are insane — definitely worth having a portion of it in your portfolio
Best regards Cecilion🎯

#APT/USDT
#APT
The price is moving within a descending channel on the 1-hour frame, adhering well to it, and is heading for a strong breakout and retest.
We are experiencing a rebound from the lower boundary of the descending channel, which is support at 4.75.
We are experiencing a downtrend on the RSI indicator that is about to be broken and retested, supporting the upward trend.
We are looking for stability above the 100 Moving Average.
Entry price: 4.95
First target: 5.06
Second target: 5.17
Third target: 5.28

APT BUYHello friends
Due to the price increase, you can now see that the price is correcting, so we have identified good support levels for you to buy in steps and with capital management and targets.
*Trade safely with us*

APT Is Squeezing Into a Reversal Pattern at a Key Weekly Level!Yello, Paradisers! Is #APT quietly gearing up for one of the cleanest reversal plays we’ve seen in weeks?
💎After a long, relentless downside trend, APT is now starting to show signs of life. The price action is compressing inside a classic falling wedge pattern, and more importantly, this is happening right at a weekly key level — the kind of setup that usually leads to significant shifts when confirmed.
💎What’s adding more weight here is the emergence of a bullish divergence on the indicators, suggesting that while price has been making new lows, momentum has already begun to turn. That’s often one of the first early signs of a coming reversal and it’s starting to gain strength.
💎#APTUSDT is now pressing against a decisive resistance zone. The price is testing the 12-hour EMA-50, currently sitting around $5.33, and just slightly above that, the wedge breakout trendline stands at approximately $5.45. These two levels are acting as the immediate gatekeepers for a bullish shift.
💎Breaking through both of these zones will be crucial. If the bulls succeed, we can expect a push toward the $7.00 – $7.35 region — a zone where short-term traders may look to take profits. However, if the momentum continues, the bigger step lies ahead.
💎A sustained breakout could carry APT to the pattern target of $8.75 – $9.25 area. This is a strong resistance zone and this is where things get more challenging. The resistance in this range is reinforced by multiple technical confluences, including the 50% Fibonacci retracement, which often acts as a magnet but also a serious barrier during recoveries.
💎On the flip side, support remains solid. Immediate support is at $4.95, while beneath that, APT sits on a major structural base that has historically held firm. Sellers will need serious volume to crack below this foundation and for now, that pressure isn’t there.
Paradisers, strive for consistency, not quick profits. Treat the market as a businessman, not as a gambler.
MyCryptoParadise
iFeel the success🌴

APTUSDT LONG 4H I expect the APT price to decrease in the POI 4H block, in which I will work out a long position with the goals indicated on the trading chart :
Targets:
$5.77
$6.44
$7.34
$8.23
Risk management - 1% on stop order

Aptos APT Will Reach $100 This CycleHello, Skyrexians!
Recently talked enough about the Bitcoin and Dominance, it's time to come back to altcoins with great potential. This is time for BINANCE:APTUSDT because it looks like to flash the insane long signal.
Let's take a look at the weekly time frame. We cannot define the Elliott waves, but we have the great performance in the past by the Bullish/Bearish Reversal Bar Indicator on this asset. Recently it flashed the green dot. You can see how it performed in the past. Moreover t is happening next to 0.61 Fibonacci zone. We can consider this move a a huge accumulation before the bull run. The target for the long term is $100.
Best regards,
Skyrexio Team
___________________________________________________________
Please, boost this article and subscribe our page if you like analysis!

APT target $8.64h time frame
-
Entry: $5.95
TP: $8.6
SL: $5.77
RR: 14.3
-
(1) APT has broken out the wedge structure on 19th Feb.
(2) Currently retesting this wedge and fibonacci 0.382 at $5.95
(3) One more time to retest $5.95 with effective support is our entry opportunity
(4) Targets analyzed from structure and fibonaaci are $7.27 and $8.76
(4) Stop loss once going below $5.77

APTUSDT Analysis: Waiting for Lower LevelsI see no reason not to wait for lower levels in APTUSDT. The market conditions suggest that there might be a better opportunity for entries at these levels.
Key Points:
Lower Levels: Waiting for lower levels might provide better risk/reward setups.
Market Conditions: Keep in mind that market conditions can change quickly, so stay cautious.
Confirmation Indicators: Use CDV, liquidity heatmaps, volume profiles, volume footprints , and upward market structure breaks in lower time frames for validation.
Learn With Me: If you're interested in learning how to use these tools for accurate demand zone identification, feel free to DM me.
If this analysis helps you, please don’t forget to boost and comment. Your support motivates me to share more insights!
If you think this analysis helps you, please don't forget to boost and comment on this. These motivate me to share more insights with you!
I keep my charts clean and simple because I believe clarity leads to better decisions.
My approach is built on years of experience and a solid track record. I don’t claim to know it all, but I’m confident in my ability to spot high-probability setups.
If you would like to learn how to use the heatmap, cumulative volume delta and volume footprint techniques that I use below to determine very accurate demand regions, you can send me a private message. I help anyone who wants it completely free of charge.
My Previous Analysis
🎯 ZENUSDT.P: Patience & Profitability | %230 Reaction from the Sniper Entry
🐶 DOGEUSDT.P: Next Move
🎨 RENDERUSDT.P: Opportunity of the Month
💎 ETHUSDT.P: Where to Retrace
🟢 BNBUSDT.P: Potential Surge
📊 BTC Dominance: Reaction Zone
🌊 WAVESUSDT.P: Demand Zone Potential
🟣 UNIUSDT.P: Long-Term Trade
🔵 XRPUSDT.P: Entry Zones
🔗 LINKUSDT.P: Follow The River
📈 BTCUSDT.P: Two Key Demand Zones
🟩 POLUSDT: Bullish Momentum
🌟 PENDLEUSDT.P: Where Opportunity Meets Precision
🔥 BTCUSDT.P: Liquidation of Highly Leveraged Longs
🌊 SOLUSDT.P: SOL's Dip - Your Opportunity
🐸 1000PEPEUSDT.P: Prime Bounce Zone Unlocked
🚀 ETHUSDT.P: Set to Explode - Don't Miss This Game Changer
🤖 IQUSDT: Smart Plan
⚡️ PONDUSDT: A Trade Not Taken Is Better Than a Losing One
💼 STMXUSDT: 2 Buying Areas
🐢 TURBOUSDT: Buy Zones and Buyer Presence
🌍 ICPUSDT.P: Massive Upside Potential | Check the Trade Update For Seeing Results
🟠 IDEXUSDT: Spot Buy Area | %26 Profit if You Trade with MSB
📌 USUALUSDT: Buyers Are Active + %70 Profit in Total
🌟 FORTHUSDT: Sniper Entry +%26 Reaction
🐳 QKCUSDT: Sniper Entry +%57 Reaction
📊 BTC.D: Retest of Key Area Highly Likely
I stopped adding to the list because it's kinda tiring to add 5-10 charts in every move but you can check my profile and see that it goes on..

Aptos (APT) Surge 16% as Token Unlocks Spark Market AnticipationAptos (APT), one of the emerging Layer 1 blockchain networks, saw a remarkable 16% price surge today despite the upcoming release of 11.31 million APT tokens—representing 1.97% of its total supply—on February 10, 2025. This release, valued at approximately $71.25 million, had initially created uncertainty, causing APT to dip 6.08% last week to $5.80, with a 20.62% drop in trading volume to $219.93 million. However, today’s bullish movement suggests traders have already priced in the token unlock event and are positioning for potential gains.
Token Unlock and Market Sentiment
Token unlocks can often introduce downward pressure due to an increase in circulating supply. However, in the case of Aptos, previous major unlock events have historically led to significant trading activity and, in some cases, price recoveries. The anticipation surrounding this unlock indicates that investors are still confident in Aptos’ long-term fundamentals and its position in the Layer 1 blockchain space.
Moreover, Aptos’ past all-time high (ATH) of $44 demonstrates its potential upside, and with market sentiment stabilizing, analysts suggest a potential rally towards $20 in the coming weeks. The broader crypto market’s resurgence and increasing demand for high-performance Layer 1 networks further support this bullish outlook.
Technical Analysis
Currently, APT is trading within a bullish zone, up 13.82% at the time of writing, with the Relative Strength Index (RSI) at 61.44—indicating strong momentum but still within a range that allows further upside movement.
- Support Level: The one-month low is serving as a key support point. If APT were to break below this level, it could test the $3 mark.
- Resistance Level: The 38.2% Fibonacci retracement level is acting as a significant resistance point. A breakout above this level could propel APT towards $10 and potentially $15.
Conclusion
Technical indicators suggest APT could target $10–$15 in the near term. As the market adjusts to the increased supply, Aptos remains one to watch in the coming weeks, with a possible move toward $20 if bullish momentum persists.

#APT/USDT#APT
The price is moving in a descending channel on the 1-hour frame and is adhering to it well and is heading to break it strongly upwards and retest it
We have a bounce from the lower limit of the descending channel, this support is at a price of 5.85
We have a downtrend on the RSI indicator that is about to break and retest, which supports the rise
We have a trend to stabilize above the Moving Average 100
Entry price 6.13
First target 6.62
Second target 6.91
Third target 7.31

Is APT Preparing to Shock the Market? Key Levels to Watch!Yello, Paradisers! Is #APT setting up for a breakout that could catch sellers completely off guard? Let’s dive in because this move could shape the next big opportunity.
💎#APTUSDT is currently trading inside a bullish falling wedge pattern—a technical setup that often signals a reversal to the upside. This pattern indicates that a potential bullish move could be in the making as the price narrows closer to a breakout point.
💎Right now, the price is approaching a critical support zone between $7.80 and $7.40, a level that has consistently acted as strong support since October 2024. History tells us this region is a key battleground for buyers and sellers, and once again, the bulls have an opportunity to step in and defend it. If they do, a reversal from this zone could catch many sellers by surprise.
💎The breakout level to watch is $8.80, and once the price clears this threshold, momentum could accelerate. The first resistance comes in at $9.30, a moderate barrier that may slow things down briefly. However, if APT powers through this level, the next major target lies at the $10.80 to $11.40 zone, which includes a Fibonacci midpoint resistance and aligns with the pattern’s projected target.
Patience and discipline are key here, Paradisers. The market often tests both bulls and bears before making decisive moves, so stay vigilant.
MyCryptoParadise
iFeel the success🌴

#APT/USDT Ready to go higher#APT
The price is moving in a descending channel on the 1-hour frame and sticking to it well
We have a bounce from the lower limit of the descending channel, this support is at a price of 4.20
We have a downtrend on the RSI indicator that is about to be broken, which supports the rise
We have a trend to stabilize above the moving average 100
Entry price 8.23
First target 8.58
Second target 8.82
Third target 9.08

APT/USDT Key Support Level in Focus for Potential Bullish RThe chart showcases a potential breakout scenario for APT/USDT, as the price is attempting to establish $10 as a solid support level. A successful confirmation of this level on higher timeframes could pave the way for a bullish rally.
Key Observations
1. The price is consolidating around the critical $10 zone, attempting to flip it into support.
2. Confirmation of $10 as support on a higher timeframe is essential to validate upward momentum.
3. Aptos remains undervalued below $10, presenting a favorable accumulation zone.
Strategic Implications
Monitor closely for higher timeframe confirmation of the $10 support level. A sustained hold above this level may trigger an upward move, making it a strong candidate for a long position. Be cautious of false breakouts and ensure adequate risk management in case of unexpected price dips.

What I expect from APTOSPretty easy chart and definitely breaking the disappointment line ( orange one ) will lead aptos to higher 50$ this year , if you have some of that juicy peach just grab onto it and wont let go , green rectangle could be recognised as the last chance to grab tho unfortunately unlikely.
Dyor boy .

AptusApt usdt Daily analysis
Time frame 4hours
Risk rewards ratio >1.8 👈👌
Technical analysis 👇
After a correction, ApTuS is gathering energy to start an upward movement.🕰🕰
The price has fallen to the gray uptrend line.
This gray line, which acts as a support, as well as another support level marked in dark blue on the chart, have created very strong support.
According to Elliott Wave Analysis, the three-point Elliott wave pattern has ended and we are now ready to start the impulse waves.
The volume chart gives us signs that an accumulation is forming in this area.
We conclude that, considering the three factors mentioned above,
1. The price is in a strong support area,
2. The Elliott wave correction has ended, and 3. Volume chart shows an accumulation area
👇👇👇👇
Based on this, we conclude that the right point and time for a price will increase and good Risk rewards ratio ~2 for traders 👌

Apt/UsdtBINANCE:APTUSDT
**Aptos (APT) Current Price: $10.62 💰**
- The current price of **Aptos (APT)** is at **$10.62**, which is a key **support level** for the price. This means that if the price holds around this level 📊, it could potentially prevent it from dropping further. Support levels act like a "floor" for the price, where demand (buyers) is strong enough to keep the price from falling.
---
**If Price Holds at $10.62 🛑, Resistance Levels Ahead:**
- **Resistance at $12 🚀**: The first major resistance level is around **$12**. This is a price point where there might be enough selling pressure (sellers) to slow down or stop the price from rising further. Think of it like a "ceiling" where the price could hit and struggle to break above.
- **Resistance at $13 🌟**: If the price breaks through $12, the next resistance is at **$13**. This is another level where the price may face increased selling pressure, making it harder for the price to go higher. However, if it breaks this resistance, it could signal further bullish momentum (more upward movement).
- **Resistance at $13.52 💥**: The final resistance level is around **$13.52**, which is likely the strongest point where the price could face significant resistance. If the price reaches this point and struggles to break through, it could signify a potential reversal or consolidation in price.
---
**Summary:**
- **Support at $10.62** 🔻: If the price holds this level, it might bounce back up.
- **Resistance Levels at $12, $13, $13.52** 🚀🌟💥: These are the points where price could face difficulty moving higher. If the price breaks through these, it could continue to rise.
---
**Not Financial Advice!** 🚨 Always remember to do your own research, as market prices can be volatile! 📈📉

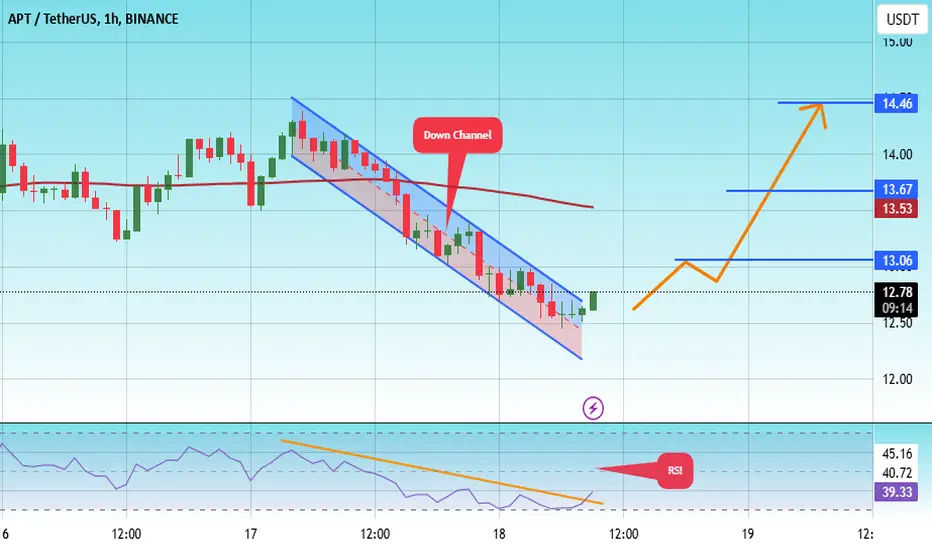
#APT/USDT Ready to go higher#APT
The price is moving in a descending channel on the 1-hour frame and sticking to it well
We have a bounce from the lower limit of the descending channel, this support is at 15.50
We have a downtrend on the RSI indicator that is about to be broken, which supports the rise
We have a trend to stabilize above the 100 moving average
Entry price 12.77
First target 13.06
Second target 13.76
Third target 14.46
APTUSDT - Real project ... Potential targets!APT is one of the important coins in layer1 Network with (7.65B marketcap)
if u want to triple ur capital then buy APT!
- Strong project
- Ranked 25 in marketcap
- displays a Cup and Handle pattern in weekly chart
- Hasn't moved strongly yet
Best regards Ceciliones🎯
