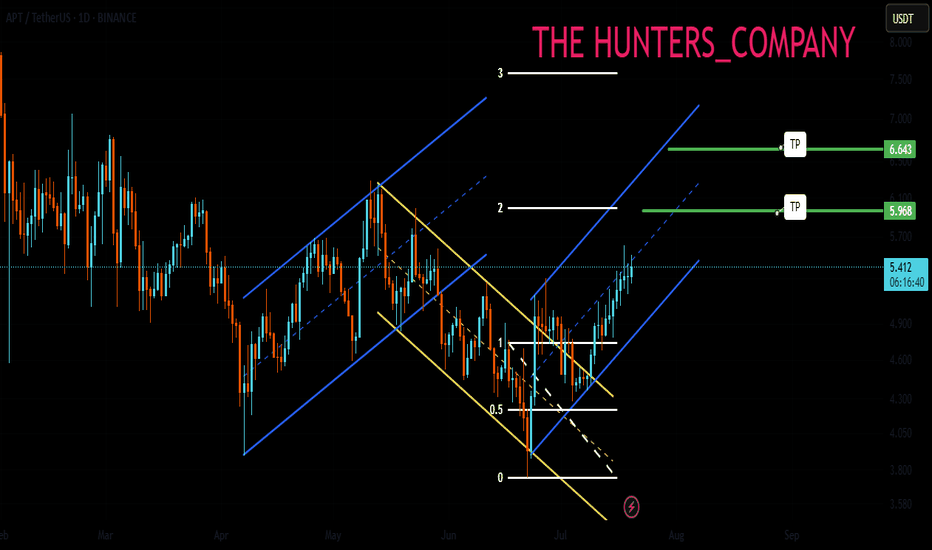
APT : Did the buyers arrive?Hello friends🙌
📈An ascending channel and then a descending channel and then an ascending channel.📉
✔The point is that when the price entered an ascending channel, your price entered and with a failure it entered a descending channel and you exited with a loss and again when the price is at the peak of despair you see that the main buyers enter and push the price up and cause a new ascending channel.
🔊Considering these tips we have told you, always have a trading plan and follow capital management so that you do not fall into the trap.
🔥Follow us for more signals🔥
*Trade safely with us*
Aptusdtidea
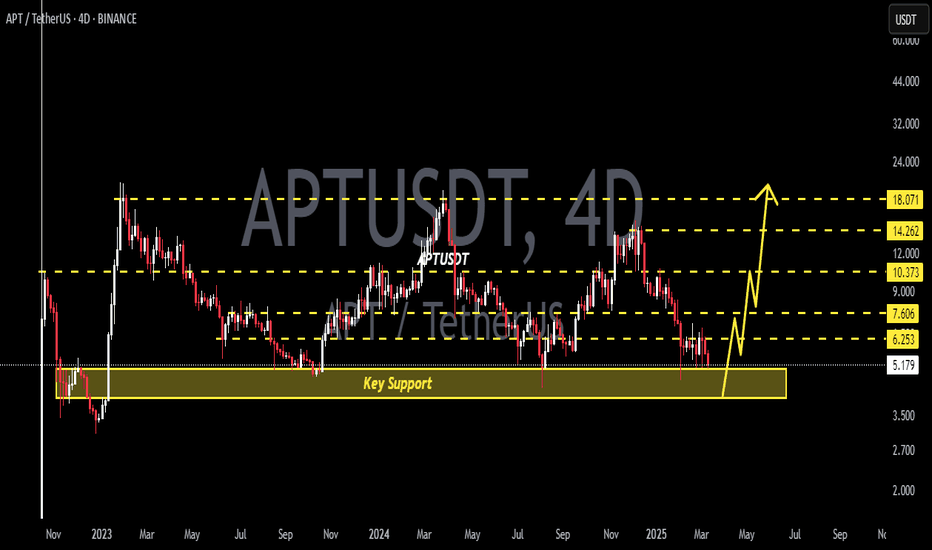
APT at Historic Support – Massive Reversal Incoming?APTUSDT technical analysis update
APT has been trading inside a descending channel for over 900 days, and it's now once again testing the channel support. As shown in the chart, the price has bounced multiple times from this level, making it a historically strong support zone.
Currently, the target is the upper boundary of the channel (resistance). If APT manages to break out of this long-term descending channel, it could trigger a strong bullish move, possibly a moonshot.
Aptos scalp n swing trade setupAptos is facing daily Order Block resistance , While on Weekly clearly showing to take out the previous high 15-16$, It's a weekly TF so it will take time. On a day trade you can take long position from the mentioned zone, while in upcoming days it's gonna hit 7.42$ at least to fill the imbalance even if it's a bear market. If any 1hr candle closes below the mentioned zone then it will take correction for short term of period then it will take flight to towards the 15-16$. If you are investor then accumulate between 4.5-5$ and set tp and forget it. If you wanna take the long position then take it from the mentioned zone if candle closes below the zone then wait for the retest and close on breakeven.
#APT/USDT
#APT
The price is moving within a descending channel on the 1-hour frame, adhering well to it, and is heading for a strong breakout and retest.
We are experiencing a rebound from the lower boundary of the descending channel, which is support at 4.75.
We are experiencing a downtrend on the RSI indicator that is about to be broken and retested, supporting the upward trend.
We are looking for stability above the 100 Moving Average.
Entry price: 4.95
First target: 5.06
Second target: 5.17
Third target: 5.28
APTUSDT LONG 4H [2 Targets Done]This position received new variables from the roar on this fall , generating EQL values of $5.04
Accordingly, the POI range test as a basis for personal expectations is confirmed :
-volume
-retention rate
-confirmation of the structure.
At the moment, 2 targets are fixed and the stop is moving to breakeven . A more detailed review can be seen in this replay:
APT target $8.64h time frame
-
Entry: $5.95
TP: $8.6
SL: $5.77
RR: 14.3
-
(1) APT has broken out the wedge structure on 19th Feb.
(2) Currently retesting this wedge and fibonacci 0.382 at $5.95
(3) One more time to retest $5.95 with effective support is our entry opportunity
(4) Targets analyzed from structure and fibonaaci are $7.27 and $8.76
(4) Stop loss once going below $5.77
APTUSDT Analysis: Waiting for Lower LevelsI see no reason not to wait for lower levels in APTUSDT. The market conditions suggest that there might be a better opportunity for entries at these levels.
Key Points:
Lower Levels: Waiting for lower levels might provide better risk/reward setups.
Market Conditions: Keep in mind that market conditions can change quickly, so stay cautious.
Confirmation Indicators: Use CDV, liquidity heatmaps, volume profiles, volume footprints , and upward market structure breaks in lower time frames for validation.
Learn With Me: If you're interested in learning how to use these tools for accurate demand zone identification, feel free to DM me.
If this analysis helps you, please don’t forget to boost and comment. Your support motivates me to share more insights!
If you think this analysis helps you, please don't forget to boost and comment on this. These motivate me to share more insights with you!
I keep my charts clean and simple because I believe clarity leads to better decisions.
My approach is built on years of experience and a solid track record. I don’t claim to know it all, but I’m confident in my ability to spot high-probability setups.
If you would like to learn how to use the heatmap, cumulative volume delta and volume footprint techniques that I use below to determine very accurate demand regions, you can send me a private message. I help anyone who wants it completely free of charge.
My Previous Analysis
🎯 ZENUSDT.P: Patience & Profitability | %230 Reaction from the Sniper Entry
🐶 DOGEUSDT.P: Next Move
🎨 RENDERUSDT.P: Opportunity of the Month
💎 ETHUSDT.P: Where to Retrace
🟢 BNBUSDT.P: Potential Surge
📊 BTC Dominance: Reaction Zone
🌊 WAVESUSDT.P: Demand Zone Potential
🟣 UNIUSDT.P: Long-Term Trade
🔵 XRPUSDT.P: Entry Zones
🔗 LINKUSDT.P: Follow The River
📈 BTCUSDT.P: Two Key Demand Zones
🟩 POLUSDT: Bullish Momentum
🌟 PENDLEUSDT.P: Where Opportunity Meets Precision
🔥 BTCUSDT.P: Liquidation of Highly Leveraged Longs
🌊 SOLUSDT.P: SOL's Dip - Your Opportunity
🐸 1000PEPEUSDT.P: Prime Bounce Zone Unlocked
🚀 ETHUSDT.P: Set to Explode - Don't Miss This Game Changer
🤖 IQUSDT: Smart Plan
⚡️ PONDUSDT: A Trade Not Taken Is Better Than a Losing One
💼 STMXUSDT: 2 Buying Areas
🐢 TURBOUSDT: Buy Zones and Buyer Presence
🌍 ICPUSDT.P: Massive Upside Potential | Check the Trade Update For Seeing Results
🟠 IDEXUSDT: Spot Buy Area | %26 Profit if You Trade with MSB
📌 USUALUSDT: Buyers Are Active + %70 Profit in Total
🌟 FORTHUSDT: Sniper Entry +%26 Reaction
🐳 QKCUSDT: Sniper Entry +%57 Reaction
📊 BTC.D: Retest of Key Area Highly Likely
I stopped adding to the list because it's kinda tiring to add 5-10 charts in every move but you can check my profile and see that it goes on..
#APT/USDT Ready to go higher#APT
The price is moving in a descending channel on the 1-hour frame and sticking to it well
We have a bounce from the lower limit of the descending channel, this support is at a price of 4.20
We have a downtrend on the RSI indicator that is about to be broken, which supports the rise
We have a trend to stabilize above the moving average 100
Entry price 8.23
First target 8.58
Second target 8.82
Third target 9.08
#APT/USDT Ready to go higher#APT
The price is moving in a descending channel on a 15-minute frame and sticking to it well
We have a bounce from the lower limit of the descending channel, this support is at 13.00
We have a downtrend on the RSI indicator that is about to be broken, which supports the rise
We have a trend to stabilize above the moving average 100
Entry price 13.40
First target 13.73
Second target 14.19
Third target 14.62
Aptos APT is ready to take off!Hello, Skyrexians!
Yesterday we considered ADA analysis and today the price of this asset started moving up and surged +14% in less than one day. Hope you were able to make a right decision. Today we will take a look at BINANCE:APTUSDT - another one interesting cryptocurrency with the great potential in the bull market.
On the chart you can see the weekly time frame for Aptos. Technically it is printing the global 2 year sideways. As you know, the sideways movement can be the accumulation or distribution. We suppose that it's accumulation before the mark up phase. Elliott waves analysis gives us the clear answer. We consider the early growth as the impulsive wave 1, after that APT is in flat correction, the wave 2, which consists of zigzag ABC. Look how perfectly wave C collected liquidity below the wave's A bottom and started going up.
Let's also notice the green dot which has been flashed by Bullish/Bearish Bars Indicator . It's is showing us the potential reversal points. Take a look how great it worker previous 2 times, indicated wave's A bottom and wave's B top. Now there is a high probability that it was the global bottom before the expansion to the upside.
The while line of the indicator showing the local support, if price is able to maintain above it, usually it leads to impulse. If our analysis is correct the wave 3 is incoming. We can calculate the targets using Fibonacci extension levels. The minimal one is $42, max target is $64.
Best regards,
Skyrexio Team
___________________________________________________________
Please, boost this article and subscribe our page if you like analysis!
APT Short📈 Current Price and Trend:
The chart shows that APTUSDT is trading around $9.12.
A bullish trend started from a strong support level, as marked with the annotation "Start Latest bull-trend". The price has moved upwards within a channel, breaking through previous resistance levels.
🔄 Pullback to Breakeven:
A pullback to the breakeven zone (highlighted in red) around $9.57 - $9.97 is seen, which may act as a key resistance area if the price attempts to rise again.
🎯 Take Profit Targets (TP):
TP-1: $9.18 📌 – This level might be a short-term resistance where partial profit can be considered.
TP-2: $8.83 📉 – Another potential target within a downward trend.
TP-3: $8.30 📉 – This level aligns with the next support, where a significant pullback could happen.
📊 Key Support and Resistance:
Resistance: Near $10.73, marked by the upper trendline, and also around $9.57 - $9.97 (breakeven pullback zone).
Support: The next strong support level is around $7.49, where a trend reversal could occur if the price drops.
⚠️ Recommendation:
Long Position: Consider entry if the price holds above the breakeven zone with targets at TP-1, TP-2, and TP-3.
Short Position: If the price fails to hold above the breakeven zone, aiming for lower targets around $8.83 and $8.30 could be prudent.
This analysis combines key price levels, potential take-profits, and possible resistance and support zones as per the channel and trendlines shown.
APTUSDT: Inverse Head and Shoulders Pattern FormationAPTUSDT technical analysis update
APT has formed an inverse head and shoulders pattern on the daily chart. The price has broken the neckline and is now retesting it as support. Additionally, the price is trading above the 100 and 200 EMAs on the daily chart. A strong bullish move is expected in the coming days.
Regards
Hexa


