Feeling Optimistic About $APTI know… it’s been over 8 months. And truth be told, AMEX:APT and I have had our ups and downs—especially between June and Oct 2023. Our relationship isn’t perfect.
But right now? This is a great technical spot. Trend is still technically down, but we’re finally seeing signs of a reversal into a key supply zone. Worth granting a small allocation here.
Main point—just putting some attention on BINANCE:APTUSDT as the market keeps looking better and better.
Aptusdtperp
APT/USDT – Price Tests Critical Historical Demand Zone!📌 Quick Summary:
APT is now at a crucial technical crossroad. After a prolonged downtrend from its previous highs, price action is once again testing the strong demand zone that historically acted as a key accumulation area. Is this the start of a new rally, or a breakdown toward uncharted lows?
---
🧱 Major Support / Demand Zone (High-Value Buy Area)
📍 $3.00 – $4.50 zone has acted as a major defensive wall since early 2023. This range represents a high-interest area for smart money accumulation, as shown by multiple strong rejections in the past.
> 🔎 Note: If this zone fails to hold, the long-term structure will flip fully bearish.
---
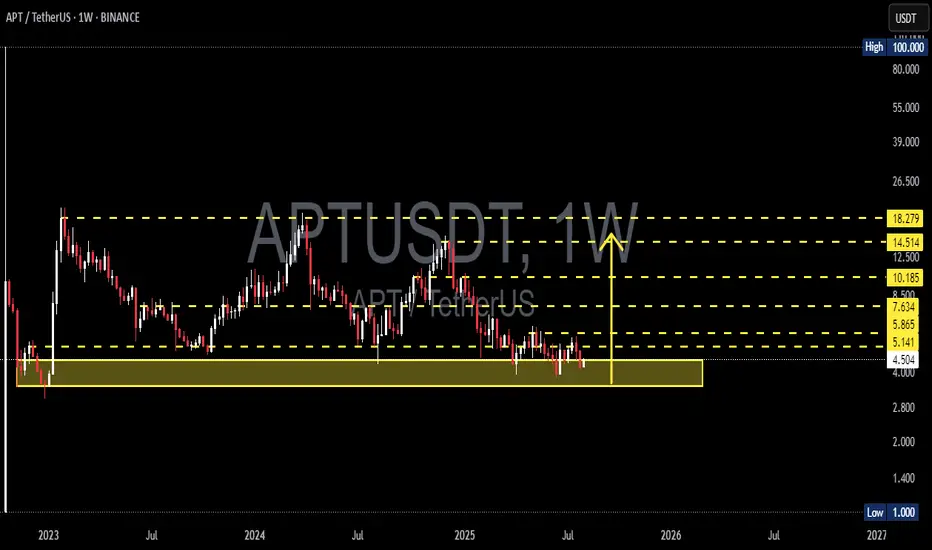
🧭 Key Resistance Levels (Bullish Targets):
These levels will act as challenges in any bullish recovery:
🔹 $4.49 – Minor resistance, first breakout confirmation.
🔹 $5.14 & $5.86 – Intermediate resistance; breaking above signals mid-trend strength.
🔹 $7.63 & $8.50 – Critical zones where past distribution occurred.
🔹 $10.18 – $12.50 – Gateway to the upper structure.
🔹 $14.51 – $18.27 – Long-term targets, last known macro resistance levels.
---
📈 Bullish Scenario: Rebound from Strong Foundation
Bullish momentum may build up if:
Weekly candlestick closes show bullish reversal patterns (hammer, engulfing, strong wicks),
Increasing buy-side volume on H4, D1, and W1 timeframes,
Clean breakout and retest of the $5.14 – $5.86 zone.
This could initiate a new bullish leg with mid-term targets around $8.00 – $10.00, and potentially higher if market conditions improve (e.g., BTC and ETH uptrending).
> 🎯 Bullish Validation: Weekly close above $7.63.
---
📉 Bearish Scenario: Full Breakdown Risk
If the $3.00 – $4.50 demand zone fails:
Price could drop toward the psychological level of $2.80 and potentially revisit the historical low of $1.00.
The major downtrend structure will be confirmed: lower highs and lower lows.
This may signal a full capitulation phase before the next cycle begins.
> ⚠️ Bearish Risk Trigger: Weekly close below $3.00 with strong volume.
---
🧠 Market Structure & Pattern Watch:
Sideways Accumulation: Multi-week tight range consolidation suggests accumulation by smart money.
Potential Double Bottom: A strong bounce from the $3.00 – $3.50 range could form a bullish reversal base.
Volume Compression: Decreasing volume suggests a buildup phase before a major move.
---
🔮 Strategic Takeaway:
APT is sitting at a make-or-break level. The $3.00 – $4.50 zone is critical for both short- and long-term structure. For swing traders and investors, this zone offers a high risk-reward opportunity — but confirmation is key.
> ⏳ Patience in the demand zone can lead to the best trades. Wait for confirmation, not hope.
#APTUSDT #AltcoinAnalysis #DemandZone #CryptoReversal #TechnicalAnalysis #PriceAction #SwingTrading #CryptoMarket
#APT/USDT Buyers Need To Establish Support Zone#APT
The price is moving within an ascending channel on the 1-hour frame, adhering well to it, and is on its way to break strongly upwards and retest it.
We have support from the lower boundary of the ascending channel, at 4.10.
We have a downtrend on the RSI indicator that is about to break and retest, supporting the upside.
There is a major support area in green at 4.05, which represents a strong basis for the upside.
Don't forget a simple thing: ease and capital.
When you reach the first target, save some money and then change your stop-loss order to an entry order.
For inquiries, please leave a comment.
We have a trend to hold above the Moving Average 100.
Entry price: 4.25.
First target: 4.35.
Second target: 4.46.
Third target: 4.05.
Don't forget a simple thing: ease and capital.
When you reach the first target, save some money and then change your stop-loss order to an entry order.
For inquiries, please leave a comment.
Thank you.

#APT/USDT#APT
The price is moving within an ascending channel on the 1-hour frame, adhering well to it, and is on track to break it strongly upwards and retest it.
We have support from the lower boundary of the ascending channel, at 0.1560.
We have a bearish trend on the RSI indicator that is about to break and retest, supporting the upside.
There is a major support area in green at 0.1555, which represents a strong basis for the upside.
Don't forget a simple thing: ease and capital.
When you reach the first target, save some money and then change your stop-loss order to an entry order.
For inquiries, please leave a comment.
We have a trend to hold above the 100 Moving Average.
Entry price: 0.1600
First target: 0.1640
Second target: 0.1677
Third target: 0.1719
Don't forget a simple thing: ease and capital.
When you reach your first target, save some money and then change your stop-loss order to an entry order.
For inquiries, please leave a comment.
Thank you.
APT : Long term purchaseHello friends🙌
👀You see that the price is in a range and now we are at the bottom of the range. The scenario is simple. The bottom of the range is a good buying opportunity that can be used because 80% of the failures in the range are fake.
⚠So we can buy with risk and capital management and move with it to the specified targets.
🔥Follow us for more signals🔥
*Trade safely with us*

APTUSDT Aptos Scalp buy / Long Setupaptos trying to breakout, wait till London session, if tp hits first then ignore, will share setup, must use sl as it's a scalp trade.

APT : Did the buyers arrive?Hello friends🙌
📈An ascending channel and then a descending channel and then an ascending channel.📉
✔The point is that when the price entered an ascending channel, your price entered and with a failure it entered a descending channel and you exited with a loss and again when the price is at the peak of despair you see that the main buyers enter and push the price up and cause a new ascending channel.
🔊Considering these tips we have told you, always have a trading plan and follow capital management so that you do not fall into the trap.
🔥Follow us for more signals🔥
*Trade safely with us*

#APT/USDT#APT
The price is moving within a descending channel on the 1-hour frame, adhering well to it, and is on its way to breaking it strongly upwards and retesting it.
We have a bounce from the lower boundary of the descending channel. This support is at 4.43.
We have a downtrend on the RSI indicator that is about to be broken and retested, supporting the upside.
There is a major support area in green at 4.35, which represents a strong basis for the upside.
Don't forget a simple thing: ease and capital.
When you reach the first target, save some money and then change your stop-loss order to an entry order.
For inquiries, please leave a comment.
We have a trend to hold above the 100 Moving Average.
Entry price: 4.47
First target: 4.50
Second target: 4.54
Third target: 4.60
Don't forget a simple thing: ease and capital.
When you reach the first target, save some money and then change your stop-loss order to an entry order.
For inquiries, please leave a comment.
Thank you.

Live tradehello friends👋
✅️Considering the drop we had, now the price has reached an important and good support and the price is supported by the buyers, and the downward trend line has broken and the ceiling has been raised. Considering this, we entered into the transaction with capital and risk management.
🔥Join us for more signals🔥
*Trade safely with us*

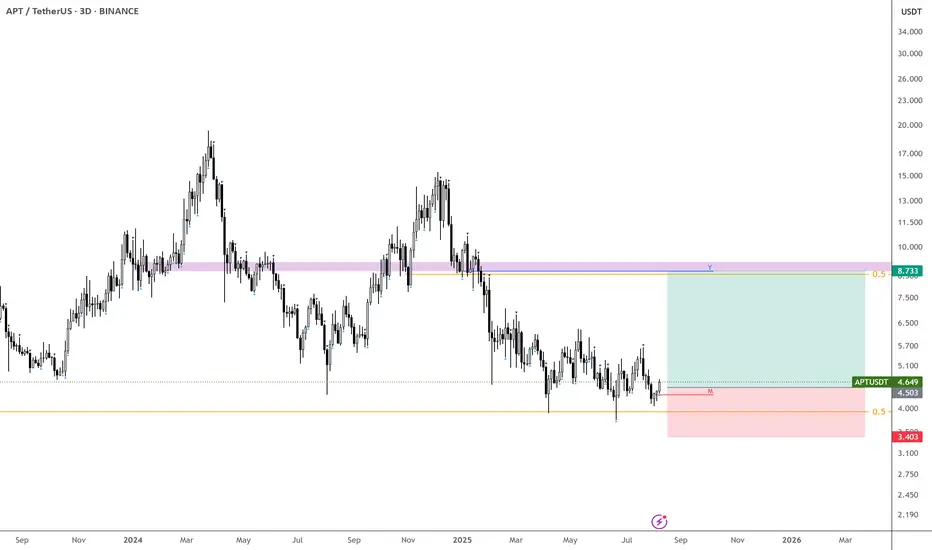
APT/USDT – Final Defense at Weekly Demand Zone! Prepare for MoveAPT is currently standing at a make-or-break level. Price has retraced back to the critical weekly demand zone between $4.00 and $4.40 — a region that previously served as the launchpad for a major rally in early 2023.
This isn't just any support — it’s a historical accumulation zone, where strong buying interest was previously observed. The big question is: Will history repeat itself, or is a major breakdown looming?
🔍 Pattern Structure and Technical Outlook:
APT has been consolidating inside a large horizontal range (accumulation box) between $4.00 and $18.27 for nearly two years.
Price is now retesting the lower boundary of this range, right at the $4.00–$4.40 zone.
Current price action shows heavy selling pressure, but buyers may step in at this demand level.
A potential double bottom or false breakdown could form if this week closes with a long lower wick and bullish body.
🟢 Bullish Scenario: Reversal from the Legendary Support
If the $4.00–$4.40 zone holds once again, we could witness a technical rebound with meaningful upside targets:
Key Bullish Targets:
1. $5.14 – Immediate minor resistance, easy to break if short-covering begins.
2. $5.86 – A key level previously rejected, acting as the first confirmation of trend reversal.
3. $7.63 – $9.00 – Former consolidation zone, potential mid-term target.
4. $10.18 to $14.51 – If momentum builds, this becomes the next major expansion zone.
> 📈 Positive catalysts such as improving crypto sentiment, strong volume inflow, or bullish fundamentals could accelerate this scenario.
🔴 Bearish Scenario: Critical Breakdown from Demand Structure
If sellers remain dominant and price closes below $4.00, this would:
Confirm a breakdown from the long-standing accumulation range
Open the door for a deeper retracement toward:
$3.50
$2.80
Possibly as low as the psychological level of $2.00
> ⚠️ Such a breakdown could indicate a major distribution phase and a loss of confidence from larger market players.
🧠 Suggested Trading Strategies:
Buy on Confirmation: Look for strong bullish reversal candles (hammer, pin bar, bullish engulfing) at the demand zone.
Breakout Strategy: Wait for a breakout and retest above $5.86–$7.63 for a safer entry.
Bearish Bias: Consider short entries on a confirmed breakdown and failed retest above $4.00.
📌 Conclusion:
APT is testing its final line of defense. The $4.00 zone remains the last stand for bulls before opening the door to deeper downside levels. Will buyers show strength once again, or are we headed for a major sell-off?
> This week’s close is crucial and could define APT’s trajectory for the upcoming quarter. Watch volume, candle structure, and buyer reaction very closely.
#APTUSDT #APTAnalysis #CryptoReversal #DemandZone #SupportAndResistance #PriceActionTrading #AltcoinSetup #TechnicalAnalysis #CryptoBreakout

Free signal hello friends👋
✅️Due to the price reaching the important weekly back support, the price is expected to grow, so you can enter into the transaction with risk and capital management and move to the specified goals.
🔥Follow us for more signals🔥
*Trade safely with us*

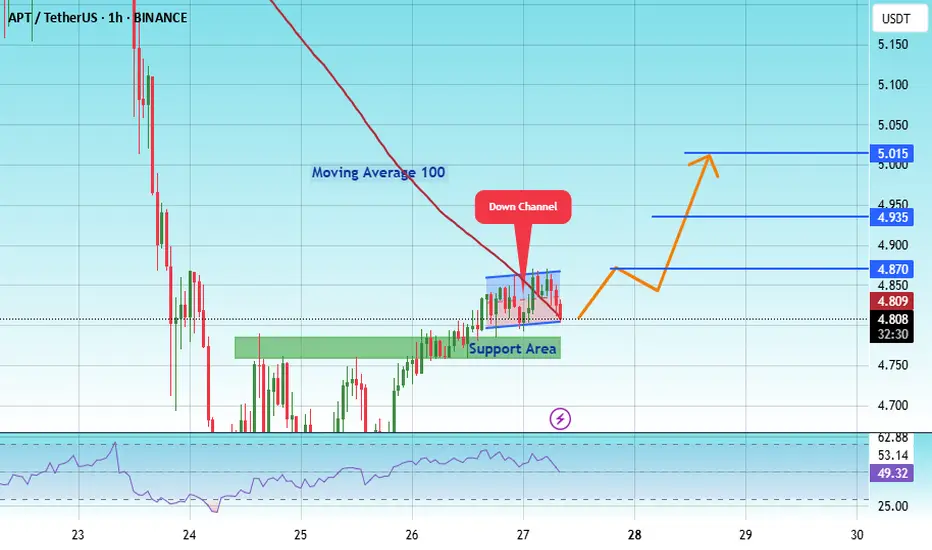
APT at 4.78 $ Historic Support – Massive Reversal Incoming?#APT
The price is moving within a descending channel on the 1-hour frame and is expected to break and continue upward.
We have a trend to stabilize above the 100 moving average once again.
We have a downtrend on the RSI indicator that supports the upward break.
We have a support area at the lower boundary of the channel at 4.78, acting as strong support from which the price can rebound.
We have a major support area in green that pushed the price higher at 4.60.
Entry price: 4.88
First target: 5.047
Second target: 5.19
Third target: 5.35
To manage risk, don't forget stop loss and capital management.
When you reach the first target, save some profits and then change your stop order to an entry order.
For inquiries, please comment.
Thank you.

#APT/USDT#APT
The price is moving within a descending channel on the 1-hour frame and is expected to break and continue upward.
We have a trend to stabilize above the 100 moving average once again.
We have a downtrend on the RSI indicator that supports the upward move with a breakout.
We have a support area at the lower boundary of the channel at 3.81, acting as strong support from which the price can rebound.
Entry price: 4.03
First target: 4.16
Second target: 4.30
Third target: 4.59

APT at Historic Support – Massive Reversal Incoming?APTUSDT technical analysis update
APT has been trading inside a descending channel for over 900 days, and it's now once again testing the channel support. As shown in the chart, the price has bounced multiple times from this level, making it a historically strong support zone.
Currently, the target is the upper boundary of the channel (resistance). If APT manages to break out of this long-term descending channel, it could trigger a strong bullish move, possibly a moonshot.

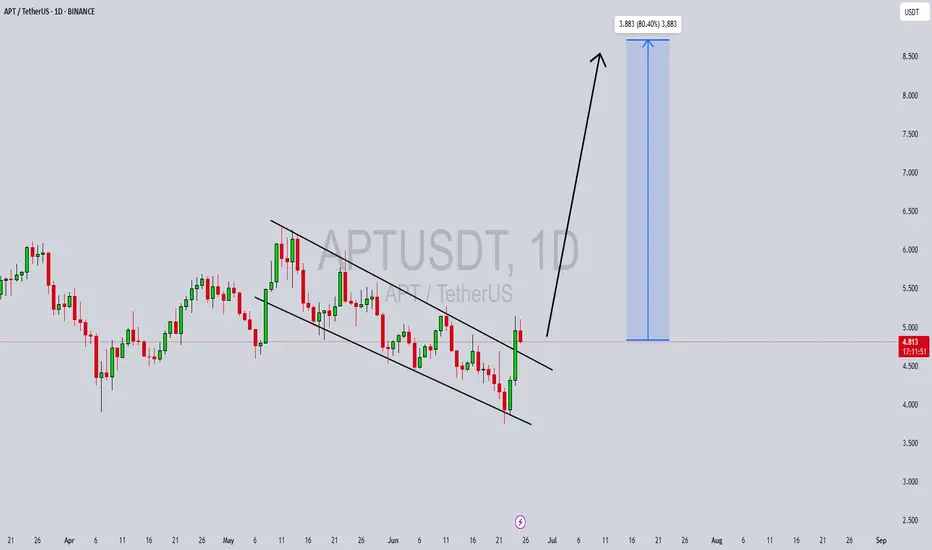
APTUSDT Forming Bullish Falling ChannelAPTUSDT is currently forming a bullish falling channel breakout, which is a classic reversal pattern indicating that the downtrend may be ending. The price action shows clear signs of compression within a downward-sloping channel, with the recent breakout suggesting a strong shift in momentum from bearish to bullish. With volume confirmation accompanying the breakout, this could signal the beginning of a powerful upside rally.
The breakout target projects a potential gain of 70% to 80%+, based on the measured move from the channel’s width. Such bullish setups are especially powerful when paired with increasing investor interest, which APT is currently experiencing. The broader crypto market sentiment is also tilting bullish, giving additional fuel to this breakout scenario. Traders and investors alike are watching APT closely as it reclaims key resistance zones and sets up for potential continuation moves.
Technical indicators such as RSI and MACD are aligning with the breakout, suggesting further strength could be ahead. The price structure also shows reduced selling pressure and more aggressive buying on dips, which supports the thesis of a medium-term rally. If APTUSDT continues to close daily candles above the channel resistance, a sustained rally to the $8–9 zone could be achievable in the coming weeks.
APT is also gaining traction within the crypto community and DeFi space, helping reinforce its long-term potential. With solid technicals and growing market engagement, APTUSDT is one of the stronger altcoin setups currently available for traders seeking breakout opportunities.
✅ Show your support by hitting the like button and
✅ Leaving a comment below! (What is You opinion about this Coin)
Your feedback and engagement keep me inspired to share more insightful market analysis with you!
APTUSDT 1W AnalysisAPT ~ 1W Analysis
#APT If you still have faith in this coin. This support can be considered to start buying back with a short-term target of at least 15%++

#APT/USDT#APT
The price is moving within a descending channel on the 1-hour frame, adhering well to it, and is heading towards a strong breakout and retest.
We are experiencing a rebound from the lower boundary of the descending channel, which is support at 4.87.
We are experiencing a downtrend on the RSI indicator that is about to be broken and retested, supporting the upward trend.
We are heading towards stability above the 100 Moving Average.
Entry price: 4.92
First target: 4.95
Second target: 5.02
Third target: 5.10

APTUSDT 1D AnalysisAPT ~ 1D Analysis
#APT Buy back gradually from here if you still have confidence in this coin with a short term target of at least 15%+ and a long term target of $15

#APT/USDT#APT
The price is moving within a descending channel on the 1-hour frame and is expected to break and continue upward.
We have a trend to stabilize above the 100 moving average once again.
We have a downtrend on the RSI indicator that supports the upward move with a breakout.
We have a support area at the lower limit of the channel at 5.50, acting as strong support from which the price can rebound.
Entry price: 5.70
First target: 5.82
Second target: 6.00
Third target: 6.17

#APT/USDT#APT
The price is moving within a descending channel on the 1-hour frame, adhering well to it, and is heading for a strong breakout and retest.
We are experiencing a rebound from the lower boundary of the descending channel, which is support at 4.95.
We are experiencing a downtrend on the RSI indicator that is about to be broken and retested, supporting the upward trend.
We are looking for stability above the 100 Moving Average.
Entry price: 5.22
First target: 5.34
Second target: 5.47
Third target: 5.65

APTUSDT 1D Analysis APT ~ 1D Analysis
#APT Buy back gradually from this support block with a short term target of at least 15%++ from here.

Aptos scalp n swing trade setupAptos is facing daily Order Block resistance , While on Weekly clearly showing to take out the previous high 15-16$, It's a weekly TF so it will take time. On a day trade you can take long position from the mentioned zone, while in upcoming days it's gonna hit 7.42$ at least to fill the imbalance even if it's a bear market. If any 1hr candle closes below the mentioned zone then it will take correction for short term of period then it will take flight to towards the 15-16$. If you are investor then accumulate between 4.5-5$ and set tp and forget it. If you wanna take the long position then take it from the mentioned zone if candle closes below the zone then wait for the retest and close on breakeven.

#APT/USDT#APT
The price is moving within a descending channel on the 1-hour frame, adhering well to it, and is heading for a strong breakout and retest.
We are seeing a bounce from the lower boundary of the descending channel, which is support at 4.60.
We have a downtrend on the RSI indicator that is about to break and retest, supporting the upward trend.
We are looking for stability above the 100 Moving Average.
Entry price: 4.76
First target: 4.88
Second target: 5.03
Third target: 5.23
