ARB LongRationale:
Multiple Divergences: Hidden Bullish Divergence: 1D price action shows a Hidden Bullish Divergence, suggesting weakening bearish momentum and potential for a bullish reversal. Bullish Divergence: 1D MACD confirms the bullish divergence, with price making lower lows while MACD forms higher lows.
Demand Zone: Current price action is within a previously identified Demand Zone, indicating a historical area of strong buying pressure and potential support.
Trend Change: 1D CHOCH has recently transitioned from a downtrend to an uptrend, signaling a shift in market sentiment and increasing the probability of further upward price movement.
Entry Strategy:
This setup utilizes two potential entry points within the identified Demand Zones:
Position 1:
Entry: 0.7272
SL: 0.6450
TP: 1.2300
Position 2:
Entry: 0.7272
SL: 0.4554
TP: 1.2300
ARB

ARB/USDT Daily Chart AnalysisLet’s dive into what’s cooking with ARB. The chart is forming a Falling Wedge Pattern, which is a textbook bullish continuation signal. Here’s my breakdown:
What I’m Seeing:
1️⃣ Falling Wedge: The price has been bouncing between the resistance and support lines, and it’s nearing a decision point. A breakout above the wedge could be HUGE! 📈
2️⃣ Key Levels:
Support: The $0.65 zone (yellow area) is holding strong for now. If this level holds, we could see some serious upward action. 👀
Resistance: First, we’ve got to break through $0.85 (red zone), and then the real test will be around $1.16. That’s the big boy resistance. 💪
3️⃣ Targets:
TP1: $1.0183 – A solid first target once the breakout is confirmed.
TP2: $1.16 – The ultimate goal if momentum stays strong. 🚀
The Plan:
📌 If ARB breaks above the wedge and retests around $0.75-$0.80, I’ll be looking for an entry. Volume confirmation is 🔑 here, so keep an eye on that.
🎯 My stops would be tight, just below $0.61 to manage risk. The R:R on this setup is juicy if it plays out.
Bearish Case:
❗️ If $0.61 breaks, the next strong support is all the way down at $0.45 (green zone). That could mean more consolidation before the next leg up.
Final Thoughts:
This setup has some great potential, but patience is key. Watch for that breakout above the wedge and don’t chase—wait for confirmation. Let me know your thoughts in the comments! Are you bullish on ARB, or do you see something different? 🤔💬
Let’s see how this plays out. LFG! 🚀🔥
#Crypto #ARB #ChartAnalysis #Trading

Alikze »» STRK | Trading range🔍 Technical analysis: Trading range
- It is in a downtrend on the 1D daily time frame.
- Currently, it is in the area between 0.33 and 0.42 as a trading range.
- In case of support in the 0.39 area, it can grow up to the supply area.
🛑 The most important resistance: 0.586
- Due to the fact that there is demand in the current area, this failure can happen from above.
- He has tested the swing several times. According to the momentum, there is an expectation of failure from above.
- But if there is consolidation below the 0.39 area and there is a break from the bottom, the bearish scenario will gain strength.
💎 Alternative scenario: Considering that the formation of a bearish flag pattern is given, if the 0.39 area is not maintained and stabilizes below the area, we can expect confirmation of the bearish flag pattern, which with the breaking of the trading range area can be a correction as much as the previous leg. experience another.
»»»«««»»»«««»»»«««
Please support this idea with a LIKE and COMMENT if you find it useful and Click "Follow" on our profile if you'd like these trade ideas delivered straight to your email in the future.
Thanks for your continued support.
Best Regards,❤️
Alikze.
»»»«««»»»«««»»»«««
BINANCE:STRKUSDT

ARB/USDT Symmetrical Triangle Breakout with Pullback OpportunityThe chart depicts a Symmetrical Triangle pattern, indicating a phase of consolidation followed by a confirmed breakout to the upside. Currently, the price is undergoing a pullback, presenting a potential opportunity for entry within the retracement zone.
Key Observations
1. The Symmetrical Triangle structure has already been breached, signaling the continuation of bullish momentum.
2. The price is retracing towards the $0.85–$0.84 zone, which aligns with key support and represents an attractive area for accumulation.
3. The projected target post-breakout is approximately $1.00, consistent with historical resistance levels and the triangle's measured move.
Strategic Implications
Focus on the pullback as a buying opportunity near $0.85–$0.84. Ensure the pullback holds within this range to confirm support and validate the bullish setup. Look for signs of reversal, such as bullish candlestick patterns or increased volume, to reinforce confidence in the trade. Set a stop-loss below $0.80 to mitigate downside risk, while aiming for the $1.00 target as the primary profit zone.

ARB LONGThis analysis compares the current price action of ARB/USDT (left chart) with the previous Bitcoin cycle (right chart). The price action suggests a potential setup for a long position at a favorable discount, identified around the 0.382 retracement level (shown in red on the ARB/USDT chart).
Key observations:
We expect a significant pullback towards the 0.382 level, which has previously acted as a key support zone, creating a potential buying opportunity.
Similar to the previous Bitcoin cycle, the current price structure shows a sharp retracement followed by a possible continuation to the upside.
The next potential resistance zone, or "buyside liquidity," is marked on the chart, which could act as a target for the upcoming move higher.
Trade Plan:
Entry: At the 0.866 level or lower, near the 0.382 retracement zone.
Stop Loss: Below 0.7558
Take Profit : Target the next resistance zone near the 1.10 level, aligning with the buyside liquidity area or higher.

ARBUSDT: Weak for Too Long, But the Blue Box Holds Promise!ARBUSDT: Weak for Too Long, But the Blue Box Holds Promise! 💪
Key Points to Consider:
Extended Weakness: ARBUSDT has been underperforming for an extended period, showing minimal strength in the market.
Blue Box Opportunity: Despite its weakness, the blue box presents a well-calculated demand zone where a reaction is highly possible.
Calculated Risk: No reason to pass up on this opportunity with proper risk management in place.
Why Take the Shot?
Even the weakest assets can rebound sharply from strategically chosen zones. This blue box is identified using advanced techniques like CDV, liquidity heatmaps, volume profiles, and volume footprints.
My Process:
When trading the blue box, I always look for confirmation with upward market structure breaks on lower time frames.
Think this approach resonates with you? Boost, comment, and follow for more insights. Let’s trade smart together! 💡
Let me tell you, folks, this is amazing. Nobody does analysis like I do. Believe me. If this helps you, don't forget to boost and comment! It’s a big deal, motivates me to share even more winning insights with you. Tremendous insights.
I keep my charts the best, clean, simple, and clear. You know it, I know it, clarity leads to better decisions. No question about it. My approach? Built on years of tremendous experience. Incredible track record. I don’t claim to know it all, but I spot high-probability setups like nobody else. Trust me.
Want to learn how to use the heatmap, cumulative volume delta, and volume footprint techniques I use to determine demand regions with stunning accuracy? Send me a private message—totally free, folks. That’s right. I help anyone who wants it, absolutely no charge. Unbelievable value.
Here’s the list, long list, great list, of some of my previous incredible analyses. Each one, a winner:
🎯 ZENUSDT.P: Patience & Profitability | %230 Reaction from the Sniper Entry
🐶 DOGEUSDT.P: Next Move
🎨 RENDERUSDT.P: Opportunity of the Month
💎 ETHUSDT.P: Where to Retrace
🟢 BNBUSDT.P: Potential Surge
📊 BTC Dominance: Reaction Zone
🌊 WAVESUSDT.P: Demand Zone Potential
🟣 UNIUSDT.P: Long-Term Trade
🔵 XRPUSDT.P: Entry Zones
🔗 LINKUSDT.P: Follow The River
📈 BTCUSDT.P: Two Key Demand Zones
🟩 POLUSDT: Bullish Momentum
🌟 PENDLEUSDT.P: Where Opportunity Meets Precision
🔥 BTCUSDT.P: Liquidation of Highly Leveraged Longs
🌊 SOLUSDT.P: SOL's Dip - Your Opportunity
🐸 1000PEPEUSDT.P: Prime Bounce Zone Unlocked
🚀 ETHUSDT.P: Set to Explode - Don't Miss This Game Changer
🤖 IQUSDT: Smart Plan
⚡️ PONDUSDT: A Trade Not Taken Is Better Than a Losing One
💼 STMXUSDT: 2 Buying Areas
🐢 TURBOUSDT: Buy Zones and Buyer Presence
🌍 ICPUSDT.P: Massive Upside Potential | Check the Trade Update For Seeing Results
🟠 IDEXUSDT: Spot Buy Area | %26 Profit if You Trade with MSB
📌 USUALUSDT: Buyers Are Active + %70 Profit in Total
🌟 FORTHUSDT: Sniper Entry +%26 Reaction
🐳 QKCUSDT: Sniper Entry +%57 Reaction
📊 BTC.D: Retest of Key Area Highly Likely
And that’s just the start. The list goes on and on, folks. It’s a tremendous list, the best. I stopped adding because, frankly, it’s tiring. So many wins. People are amazed. You can check my profile and see for yourself, winning moves, all the time. Believe me, nobody does it better.

#ARB/USDT Ready to go higher#ARB
The price is moving in a descending channel on the 1-hour frame and sticking to it well
We have a bounce from the lower limit of the descending channel, this support is at 0.7400
We have a downtrend on the RSI indicator that is about to be broken, which supports the rise
We have a trend to stabilize above the moving average 100
Entry price 0.7600
First target 0.7911
Second target 0.8161
Third target 0.8400

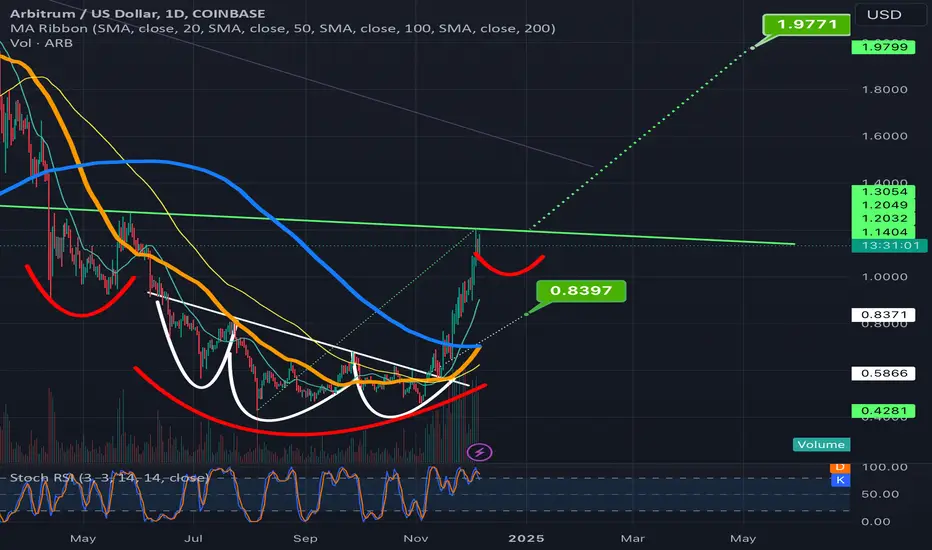
ARB breaking up from a bullflag that can take it above necklineArbitrum looks like it has probably founded the lowest depth of the right shoulder of it’s inverse head and shoulders here as it has now broken upward from this purple bullflag here and is now back above the 1 day 50ma(in orange). The breakout target of this flag will take price action above the neckline of the inverse head and shoulders pattern if it hit its full breakout target. We can also see that the bearish h&s that we were under the neckline of for several daily candle closes never progressed into getting validated as is often the case with bearish patterns in this phase of the bull market. I suppose there’s still a chance we could head bck under that light colored tannish neckline again but probability favor the upside at this point. *not financial advice*

#ARB (SPOT) entry range( 0.4650- 0.6150) T.(1.3990) SL(0.4287)BINANCE:ARBUSDT
entry range ( 0.4650- 0.6150)
Target1 (0.9000) - Target2 (1.0740)- Target3 (1.3990)
1 Extra Targets(optional) in chart, if you like to continue in the trade with making stoploss very high.
SL .1D close below (0.4287)
*** collect the coin slowly in the entry range ***
*** No FOMO - No Rush , it is a long journey ***
**** #Manta ,#OMNI, #DYM, #AI, #IO, #XAI , #ACE #NFP #RAD #WLD #ORDI #BLUR #SUI #Voxel #AEVO #VITE #APE #RDNT #FLUX #NMR #VANRY #TRB #HBAR #DGB #XEC #ERN #ALT #IO #ACA #HIVE #ASTR #ARDR #PIXEL #LTO #AERGO #SCRT #ATA #HOOK #FLOW #KSM #HFT #MINA #DATA #SC #JOE #RDNT #IQ #CFX #BICO #ARB ****

3 Emerging Crypto to watch in 2025Since you enjoyed my previous post about 3 Crypto OGs to watch this month...
Here's an interesting one about 3 Emerging Crypto to watch in 2025:
BINANCE:ARBUSDT
ARB rejected a strong a strong support and demand zone marked in red.
Waiting for a break above $0.85 structure marked in blue to activate the next bullish impulse towards the $1.5 mark.🎯
BINANCE:TIAUSDT
TIA rejected a strong a strong support and demand zone marked in red.
Waiting for a break above $5.7 structure marked in blue to activate the next bullish impulse towards the $10 mark.🎯
BINANCE:MKRUSDT
MKR rejected a strong a strong support and demand zone marked in red.
Waiting for a break above $1700 structure marked in blue to activate the next bullish impulse towards the $2500 mark.🎯
Which altcoins would you like me to cover next?
All Strategies Are Good; If Managed Properly!
~Rich

ARBUSDT Analysis: Logical Blue BoxesThere’s no reason not to wait for lower levels in ARBUSDT. The blue boxes marked here are identified as reasonable zones for potential entries.
Key Points:
Blue Boxes: These are calculated as potential demand areas based on multiple factors.
Market Risk: Maintain cautious risk management, as general conditions remain uncertain.
Confirmation Indicators: As always, entries should be validated using CDV, liquidity heatmaps, volume profiles, volume footprints, and upward market structure breaks in lower time frames.
Learn With Me: Want to learn how to use CDV, liquidity heatmaps, volume profiles, and volume footprints to find precise demand zones? DM me for insights.
If this analysis helps you, please don’t forget to boost and comment. Your support motivates me to share more!
If you think this analysis helps you, please don't forget to boost and comment on this. These motivate me to share more insights with you!
I keep my charts clean and simple because I believe clarity leads to better decisions.
My approach is built on years of experience and a solid track record. I don’t claim to know it all, but I’m confident in my ability to spot high-probability setups.
If you would like to learn how to use the heatmap, cumulative volume delta and volume footprint techniques that I use below to determine very accurate demand regions, you can send me a private message. I help anyone who wants it completely free of charge.
My Previous Analysis
🎯 ZENUSDT.P: Patience & Profitability | %230 Reaction from the Sniper Entry
🐶 DOGEUSDT.P: Next Move
🎨 RENDERUSDT.P: Opportunity of the Month
💎 ETHUSDT.P: Where to Retrace
🟢 BNBUSDT.P: Potential Surge
📊 BTC Dominance: Reaction Zone
🌊 WAVESUSDT.P: Demand Zone Potential
🟣 UNIUSDT.P: Long-Term Trade
🔵 XRPUSDT.P: Entry Zones
🔗 LINKUSDT.P: Follow The River
📈 BTCUSDT.P: Two Key Demand Zones
🟩 POLUSDT: Bullish Momentum
🌟 PENDLEUSDT.P: Where Opportunity Meets Precision
🔥 BTCUSDT.P: Liquidation of Highly Leveraged Longs
🌊 SOLUSDT.P: SOL's Dip - Your Opportunity
🐸 1000PEPEUSDT.P: Prime Bounce Zone Unlocked
🚀 ETHUSDT.P: Set to Explode - Don't Miss This Game Changer
🤖 IQUSDT: Smart Plan
⚡️ PONDUSDT: A Trade Not Taken Is Better Than a Losing One
💼 STMXUSDT: 2 Buying Areas
🐢 TURBOUSDT: Buy Zones and Buyer Presence
🌍 ICPUSDT.P: Massive Upside Potential | Check the Trade Update For Seeing Results
🟠 IDEXUSDT: Spot Buy Area | %26 Profit if You Trade with MSB
📌 USUALUSDT: Buyers Are Active + %70 Profit in Total
🌟 FORTHUSDT: Sniper Entry +%26 Reaction
🐳 QKCUSDT: Sniper Entry +%57 Reaction
📊 BTC.D: Retest of Key Area Highly Likely
I stopped adding to the list because it's kinda tiring to add 5-10 charts in every move but you can check my profile and see that it goes on..

Could ARBUSDT Be Gearing Up for a Breakout?Yello, Paradisers! ARBUSDT is showing good signs of bullish momentum as it completes a proper retracement with descending channel and begins forming a W-pattern near the key support zone. This classic pattern is a strong signal that the odds of an upward move are increasing.
💎However, to confirm this bullish scenario, ARBUSDT needs to break out above the resistance level following the completion of this W-pattern. Until then, there’s potential for consolidation or even another retracement. This is why waiting for a clean breakout is critical to avoid premature entries.
💎In the event of panic selling, the strong support zone could act as a bounce-back level. To increase confidence in this scenario, we’ll need to see a bullish I-CHoCH (Internal Change of Character) on lower timeframes. Additionally, ARB’s strong fundamentals add weight to the probability of a recovery from support.
💎On the flip side, if ARBUSDT breaks down and closes candle below the support zone, this would invalidate the bullish setup entirely. In this case, it’s prudent to stay patient and wait for a better price action structure to form before taking any positions.
Trade smart, Paradisers, and remember—discipline, patience, and a solid strategy are your greatest tools in navigating the market successfully!
MyCryptoParadise
iFeel the success🌴

Arbitrum | 1D analysis- Arbitrum Daily Timeframe Analysis with Fundamental Analysis
In addition to the pre-launch record of $4 billion in TVL , Arbitrum has a perfect future based on its data and activities !
- After the start and launch of the Arbitrum Nitro update, the price can increase by up to + $50 due to its scalability capabilities as well as the masterpiece architecture of the Nitro blockchain.

ARB | ALTCOINS | Can ARB see a new ATH?With BTC trading above 100k, it's only a matter of time before liquidity rotates back into alts.
This usually happens in a very specific order, with ETH being first, and then other alts by higher market caps, and then random parabolic rallies across the smaller market cap coins - such as Arb.
I'm anticipating a new ETH all time high, because there is just no way BTC makes such a significant new ATH and ETH stays behind However, we may need to have some patience for ETH to get to this point. And after that - we can expect everything else to have their share of the limelight.
__________________
BINANCE:ARBUSDT

#ARB/USDT#ARB
The price is moving in a descending channel on a 30-minute frame and is expected to continue upwards
We have a trend to stabilize above the moving average 100 again
We have a descending trend on the RSI indicator that supports the rise by breaking it upwards
We have a support area at the lower limit of the channel at a price of 0.9861
Entry price 0.9861
First target 1.024
Second target 1.0
Third target 1.10

I bought #ARB at this level, stop below the areaThere is an important level for this currency that has shown so far that it is going to hold, exit if it is broken.
#ARB/USDT

ARB Long Spot Trade (Bullish Momentum with ETH Adoption) Market Context:
ARB is demonstrating bullish momentum in alignment with Ethereum’s adoption surge. A clear structure shift is evident, with ARB printing a higher high and reclaiming its range low. A retest of this range low and the 200-day EMA as support provides an ideal entry point.
Trade Details:
Entry Zone: $0.74 - $0.79
Take Profit Targets:
First target: $1.30
Second target: $1.80
Stop Loss: Daily close below $0.60
This setup combines strong technical confirmation and Ethereum’s broader trend, offering a favorable risk-to-reward opportunity.

time to buy ARB. Hi guys. It is bull run and normal consolidation. It is time to buy arb 0.95$ here. Next target is 2$.

#ARB/USDT Ready to go higher#ARB
The price is moving in a descending channel on the 1-hour frame and sticking to it well
We have a bounce from the lower limit of the descending channel, this support is at 1.07
We have a downtrend on the RSI indicator that is about to break, which supports the rise
We have a trend to stabilize above the 100 moving average
Entry price 1.07
First target 1.13
Second target 1.17
Third target 1.23

ARB Analysis Pump IT Looking at this chart, do not underestimate the potential of ARB. The price could reach its target much faster than expected, potentially even before the projected timeline of April 2025.
If it does reach this level ahead of schedule, you’ll be surprised by the price it achieves. Let’s just say it’s a double-digit figure, but I’ll keep the exact number to myself for now.
Stay tuned—this is going to be an exciting journey! 🚀

Arbitrum set to goldencross on next daily candle; invh&s in playWe can see after triggering the breakout of the smaller inverse head and shoulders and blowing past that target arbitrum has reached the perfect level that will cause this new inverse head and shoulders to materialize by correcting here and forming a right shoulder. We can also see that Arbitrum is just 1 day away from having it’s daily golden cross and considering many inverse head and boulder patterns in the altcoin market lately have been forming remarkably tiny right shoulders, Arbitrum also could follow suit and break up from the inverse head and shoulder neckline far sooner than you would normally ever expect these kind of patterns to do so. Also a chance it could form a normal shoulder here as well we wll know soon enough *not financial advice*
Alikze »» W | Ascending channel - 1D🔍 Technical analysis: Ascending channel - 1D
- It has been moving in a downward channel on the daily time frame
- After breaking the short-term downward channel, it is currently moving in an upward channel
- According to the momentum at the top of the channel, it can exit the channel with a pullback to the broken structure and continue its growth up to the first supply range as wide as the channel.
- In the future, it can continue its growth by breaking the first supply area to the second supply area.
💎 Alternative scenario: In addition, if the green box area is broken, it can go down with a pullback to the 0.1709 range.
»»»«««»»»«««»»»«««
Please support this idea with a LIKE and COMMENT if you find it useful and Click "Follow" on our profile if you'd like these trade ideas delivered straight to your email in the future.
Thanks for your continued support.
Best Regards,❤️
Alikze.
»»»«««»»»«««»»»«««
BINANCE:WUSDT

#ARB/USDT Ready to go up#ARB
The price is moving in a descending channel on the 30-minute frame and sticking to it well
We have a bounce from the lower limit of the descending channel, this support is at 0.8400
We have a downtrend on the RSI indicator that is about to be broken, which supports the rise
We have a trend to stabilize above the moving average 100
Entry price 0.8684
First target 0.8922
Second target 0.9288
Third target 0.9647
