#ARB/USDT#ARB
The price is moving within a descending channel on the 1-hour frame, adhering well to it, and is on its way to breaking strongly upwards and retesting it.
We have support from the lower boundary of the descending channel, at 0.4550.
We have a downtrend on the RSI indicator that is about to be broken and retested, supporting the upside.
There is a major support area in green at 0.4520, which represents a strong basis for the upside.
Don't forget a simple thing: ease and capital.
When you reach the first target, save some money and then change your stop-loss order to an entry order.
For inquiries, please leave a comment.
We have a trend to hold above the 100 Moving Average.
Entry price: 0.4616
First target: 0.4751
Second target: 0.4923
Third target: 0.5135
Don't forget a simple thing: ease and capital.
When you reach the first target, save some money and then change your stop-loss order to an entry order.
For inquiries, please leave a comment.
Thank you.
Arbitrage

#ARB/USDT Arbitrum scalp long to $ 0.5122#ARB
The price is moving within a descending channel on the 1-hour frame, adhering well to it, and is on its way to breaking strongly upwards and retesting it.
We have support from the lower boundary of the descending channel at 0.4270.
We have a downtrend on the RSI indicator that is about to be broken and retested, supporting the upside.
There is a major support area in green at 0.4300, which represents a strong basis for the upside.
Don't forget a simple thing: ease and capital.
When you reach the first target, save some money and then change your stop-loss order to an entry order.
For inquiries, please leave a comment.
We have a trend to hold above the 100 Moving Average.
Entry price: 0.4720
First target: 0.5554
Second target: 0.4982
Third target: 0.5122
Don't forget a simple thing: ease and capital.
When you reach your first target, save some money and then change your stop-loss order to an entry order.
For inquiries, please leave a comment.
Thank you.

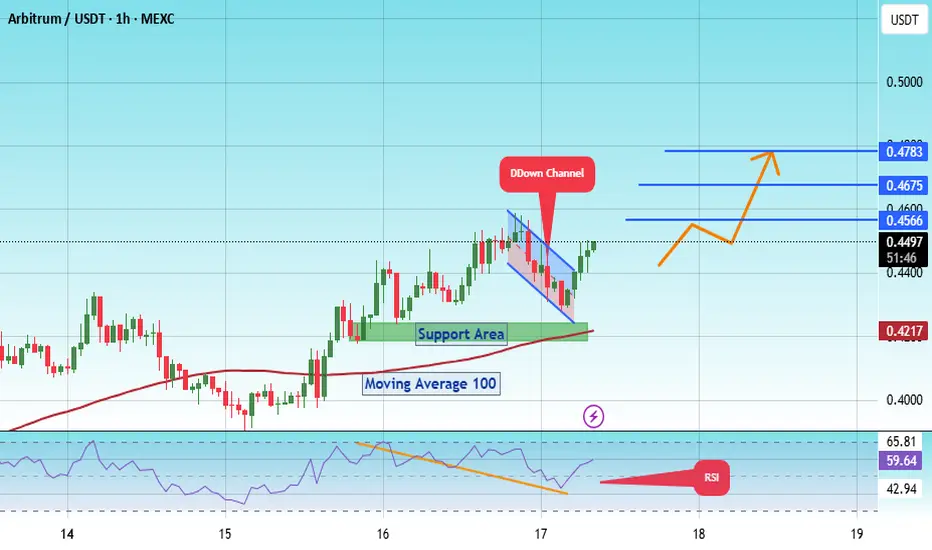
#ARB/USDT Arbitrum scalp long to $ 0.4783#ARB
The price is moving within a descending channel on the 1-hour frame, adhering well to it, and is poised to break it strongly upwards and retest it.
We have 0.4254 from the lower boundary of the descending channel. This support is at 0.0001500.
We have a downtrend on the RSI indicator that is about to be broken and retested, supporting the upward move.
There is a key support area in green at 0.4170, which represents a strong basis for the upward move.
Don't forget one simple thing: ease and capital.
When you reach the first target, save some money and then change your stop-loss order to an entry order.
For inquiries, please leave a comment.
We have a trend of stability above the Moving Average 100.
Entry price: 0.4484
First target: 0.4566
Second target: 0.4675
Third target: 0.4783
Don't forget one simple thing: ease and capital.
When you reach the first target, save some money and then change your stop-loss order to an entry order.
For inquiries, please leave a comment.
Thank you.
#ARB/USDT Arbitrum scalp long to $ 0.4451#ARB
The price is moving within a descending channel on the 15-minute frame and is expected to break and continue upward.
We have a trend to stabilize above the 100 Moving Average once again.
We have a bearish trend on the RSI indicator, supporting the upward break.
We have a support area at the lower boundary of the channel at 0.4070, acting as strong support from which the price can rebound.
We have a major support area in green that pushed the price upward at 0.3970.
Entry price: 0.4160.
First target: 0.4300.
Second target: 0.4407.
Third target: 0.4451.
To manage risk, don't forget stop loss and capital management.
When you reach the first target, save some profits and then change the stop order to an entry order.
For inquiries, please comment.
Thank you.

Sprott Copper Arbitrage against LME copper futures, discount 20%Currently COP.UN (traded on TSX, Toronto Stock Exchange) is showing some substantial discount again against NAV. Discount is more than 20% which basically means that you can buy copper on the world markets (LME) with a 20% discount! I expect discount will narrow again in coming weeks and wil go back to minus 10 or even better.
A more detailed description can be find below of all facts and figures.
Current Situation:
Discount to NAV: COP.UN is trading at just over a 20% discount to its net asset value (NAV). Essentially, this means you can buy copper exposure at a significant discount to the current market price.
Copper Storage and Transfers: The trust’s copper is stored in LME-approved warehouses and is increasingly being shipped to COMEX warehouses in the U.S. The reason is straightforward: copper prices on COMEX are currently higher than on the LME. By moving copper to COMEX, Sprott can sell inventory at better prices.
Mechanism for Payouts: The proceeds from selling copper at a premium on COMEX versus the LME can be distributed to unitholders as a special cash distribution (dividend). This provides a direct way for investors to benefit from arbitrage between exchanges.
Redemption Option: Institutional investors can redeem trust units for physical copper, subject to minimum tonnages and fees. This helps keep the trust price connected to physical copper markets and offers an arbitrage route if the discount remains wide.
The Opportunity:
This setup offers trading houses huge opportunities:
Arbitrage Play: Buy COP.UN units at a >20% discount, redeem them for physical copper, and sell the metal at spot prices, pocketing the spread (net of costs).
Dividend Upside: Hold COP.UN units and potentially benefit from future special dividends if Sprott continues moving copper to COMEX and realizing higher sales prices.
Useful Resources:
COP.UN Prospectus (Sprott Physical Copper Trust) cop-prospectus-en.pdf

#ARB Can Long Soon#ARB
The price is moving within a descending channel on the 1-hour frame and is expected to break and continue upward.
We have a trend to stabilize above the 100 moving average once again.
We have a downtrend on the RSI indicator that supports the upward move with a breakout.
We have a support area at the lower boundary of the channel at 0.3190, acting as strong support from which the price can rebound.
We have a major support area in green that pushed the price upward at 0.3180.
Entry price: 0.3200
First target: 0.3297
Second target: 0.3393
Third target: 0.3513
To manage risk, don't forget stop loss and capital management.
When you reach the first target, save some profits and then change your stop order to an entry order.
For inquiries, please comment.
Thank you.

#ARB/USDT Ready for a Major Breakout!#ARB
The price is moving within a descending channel on the 1-hour frame, adhering well to it, and is heading for a strong breakout and retest.
We are seeing a bounce from the lower boundary of the descending channel. This support is at 0.3500.
We have a downtrend on the RSI indicator that is about to be broken and retested, supporting the upside.
There is a major support area in green at 0.3050, which represents a strong basis for the upside.
Don't forget a simple thing: ease and capital.
When you reach the first target, save some money and then change your stop-loss order to an entry order.
For inquiries, please leave a comment.
We are looking to hold above the 100 Moving Average.
Entry price: 0.3640
First target: 0.3828
Second target: 0.4009
Third target: 0.4229
Don't forget a simple thing: ease and capital.
When you reach your first target, save some money and then change your stop-loss order to an entry order.
For inquiries, please leave a comment.
Thank you.

#ARB/USDT#ARB
The price is moving within a descending channel on the 1-hour frame and is expected to break and continue upward.
We have a trend to stabilize above the 100 moving average once again.
We have a downtrend on the RSI indicator, which supports the upward move by breaking it upward.
We have a support area at the lower limit of the channel at 0.3382, acting as strong support from which the price can rebound.
Entry price: 0.3408
First target: 0.3466
Second target: 0.3523
Third target: 0.3596

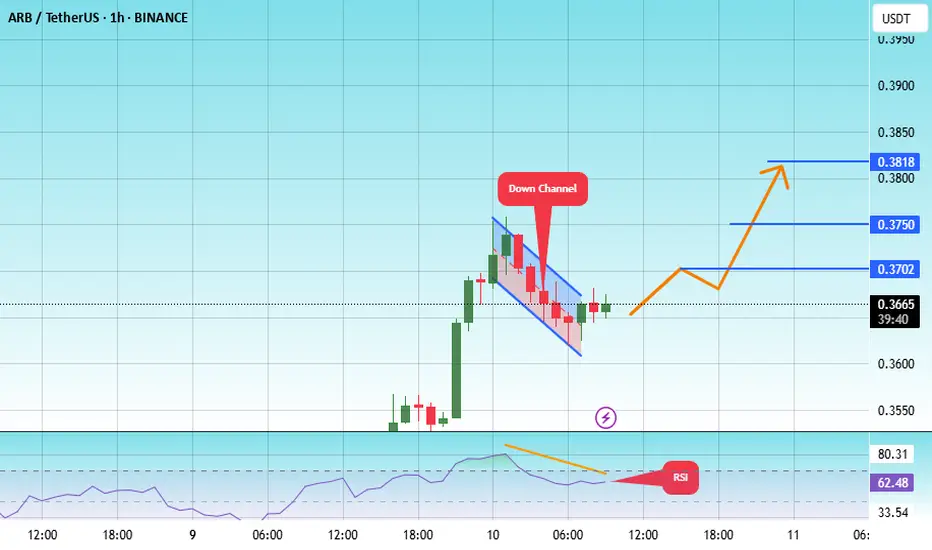
#ARB/USDT#ARB
The price is moving within a descending channel on the 1-hour frame, adhering well to it, and is heading towards a strong breakout and retest.
We are experiencing a rebound from the lower boundary of the descending channel. This support is at 0.3620.
We are experiencing a downtrend on the RSI indicator, which is about to break and retest, supporting the upward trend.
We are heading towards stability above the 100 moving average.
Entry price: 0.3667
First target: 0.3700
Second target: 0.3750
Third target: 0.3820
#ARB/USDT#ARB
The price is moving within a descending channel on the 1-hour frame and is expected to break and continue upward.
We have a trend to stabilize above the 100 moving average once again.
We have a downtrend on the RSI indicator, which supports the upward move by breaking it upward.
We have a support area at the lower limit of the channel at 0.3210, acting as strong support from which the price can rebound.
Entry price: 0.3250
First target: 0.3406
Second target: 0.3510
Third target: 0.3667

#ARB/USDT#ARB
The price is moving within a descending channel on the 1-hour frame and is expected to break and continue upward.
We have a trend to stabilize above the 100 moving average once again.
We have a downtrend on the RSI indicator, which supports the upward move by breaking it upward.
We have a support area at the lower limit of the channel at 0.4033, acting as strong support from which the price can rebound.
Entry price: 0.4120
First target: 0.4229
Second target: 0.4373
Third target: 0.4540

#ARB/USDT#ARB
The price is moving within a descending channel on the 1-hour frame, adhering well to it, and is heading for a strong breakout and retest.
We are experiencing a rebound from the lower boundary of the descending channel, which is support at 4050.
We are experiencing a downtrend on the RSI indicator, which is about to be broken and retested, supporting the upward trend.
We are looking for stability above the 100 Moving Average.
Entry price: 0.4436
First target: 0.4700
Second target: 0.4994
Third target: 0.5367

#ARB/USDT#ARB
The price is moving in a descending channel on the 1-hour frame and is adhering to it well and is heading to break it strongly upwards and retest it
We have a rebound from the lower limit of the descending channel, this support is at a price of 0.3640
We have a downtrend on the RSI indicator that is about to be broken and retested, which supports the rise
We have a trend to stabilize above the moving average 100
Entry price 0.3730
First target 0.3890
Second target 0.4047
Third target 0.4266

#ARB/USDT Ready to launch upwards#ARB
The price is moving in a descending channel on the 1-hour frame and is adhering to it well and is heading to break it strongly upwards
We have a bounce from the lower limit of the descending channel, this support is at a price of 0.5960
We have a downtrend on the RSI indicator that is about to be broken, which supports the rise
We have a trend to stabilize above the moving average 100
Entry price 0.6220
First target 0.6567
Second target 0.6890
Third target 0.7262

OCS arbitrageOCS arbitrage between icelandic and US market. This is a risk free trade given a couple of things.

Sprott Physical Copper Trust (symbol, COP.UN) traded in Canada COP.UN is showing a big discount of about 20% against NAV
So a buy set up in COP.UN around current levels of about CAD 9,65 could show some nice profits
in the coming months when the discount will probably getting smaller.
Potential upside 20%
Long positions in COP.UN can be hedged by going short CPER (Copper ETF) in the US market to hedge against price drops in COP.UN

#ARB/USDT#ARB
The price is moving in a descending channel on a 30-minute frame and is expected to continue upwards
We have a trend to stabilize above the moving average 100 again
We have a descending trend on the RSI indicator that supports the rise by breaking it upwards
We have a support area at the lower limit of the channel at a price of 0.9861
Entry price 0.9861
First target 1.024
Second target 1.0
Third target 1.10

#ARB/USDT Ready to go higher#ARB
The price is moving in a descending channel on the 1-hour frame and sticking to it well
We have a bounce from the lower limit of the descending channel, this support is at 1.07
We have a downtrend on the RSI indicator that is about to break, which supports the rise
We have a trend to stabilize above the 100 moving average
Entry price 1.07
First target 1.13
Second target 1.17
Third target 1.23

#ARB/USDT Ready to go up#ARB
The price is moving in a descending channel on the 30-minute frame and sticking to it well
We have a bounce from the lower limit of the descending channel, this support is at 0.8400
We have a downtrend on the RSI indicator that is about to be broken, which supports the rise
We have a trend to stabilize above the moving average 100
Entry price 0.8684
First target 0.8922
Second target 0.9288
Third target 0.9647

HES CVX M&A ArbitrageCVX & HES are expected to complete a merger on 6/30/25. CVX will pay every holder of HES stock 1.025 shares of CVX per share of HES. This is represented by the spread. Spread has been widening since announcement date, and would be interesting to make a play on. FTC seems to be interested in having a say in the merger.
NYSE:CVX *1.025-NYSE:HES

#ARB/USDT#ARB
The price is moving in a descending channel on the 1-hour frame upwards and is expected to continue.
We have a trend to stabilize above the moving average 100 again.
We have a downtrend on the RSI indicator that supports the rise by breaking it upwards.
We have a support area at the lower limit of the channel at a price of
0.5700.
Entry price 0.5290.
First target 0.6113.
Second target 0.6346.
Third target 0.6583.

MSTU Oct 2024 -- an 8X+ BTC surrogate MSTU provides 2X on MSTR which invented the BTC-on-balance-sheet strategy.
MSTR has been providing approx > 4X on Bitcoin movements (up and down).
This means MSTU is providing > 8% X on BTC by % movements.
Today, 10/24/24, when BTC went up 1.93% MSTU went up approx 21%
Long Call options on MSTU further amplify this multiplier effect.
Not financial advice, Do your own research, Get in and out at the right times,
Your money; your decisions.

#ARB/USDT#ARB
The price is moving in a descending channel on the 4-hour frame
And it is sticking to it well
We have a bounce from the lower limit of the descending channel and we are now touching this support at a price of 0.5170
We have a downtrend on the RSI indicator that is about to be broken, which supports the rise
We have a trend to stabilize above the moving average 100
Entry price 0.5390
First target 0.5642
Second target 0.5912
Third target 0.6240
