#ARB/USDT#ARB
The price is moving within a descending channel on the 1-hour frame and is expected to break and continue upward.
We have a trend to stabilize above the 100 moving average once again.
We have a downtrend on the RSI indicator, which supports the upward move by breaking it upward.
We have a support area at the lower limit of the channel at 0.3382, acting as strong support from which the price can rebound.
Entry price: 0.3408
First target: 0.3466
Second target: 0.3523
Third target: 0.3596
Arbitrum

#ARB/USDT#ARB
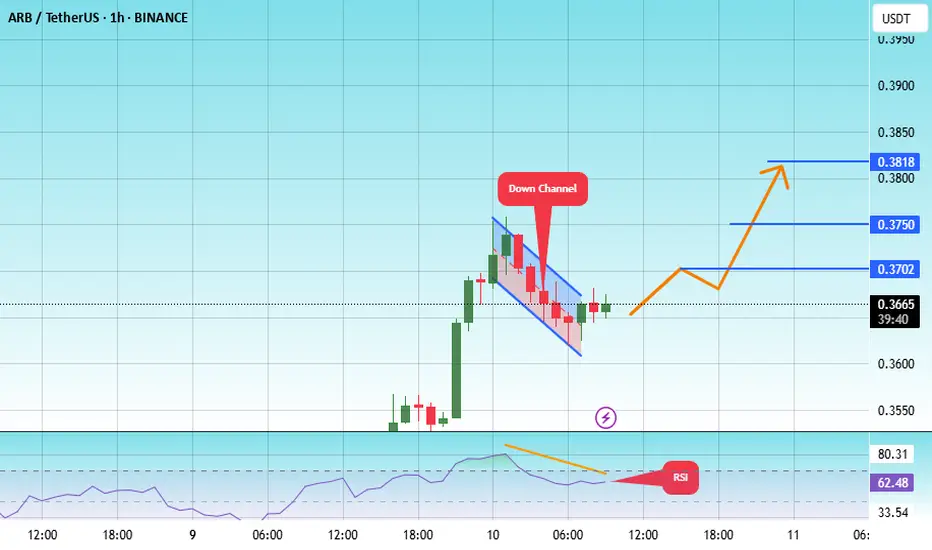
The price is moving within a descending channel on the 1-hour frame, adhering well to it, and is heading towards a strong breakout and retest.
We are experiencing a rebound from the lower boundary of the descending channel. This support is at 0.3620.
We are experiencing a downtrend on the RSI indicator, which is about to break and retest, supporting the upward trend.
We are heading towards stability above the 100 moving average.
Entry price: 0.3667
First target: 0.3700
Second target: 0.3750
Third target: 0.3820
#ARB/USDT#ARB
The price is moving within a descending channel on the 1-hour frame and is expected to break and continue upward.
We have a trend to stabilize above the 100 moving average once again.
We have a downtrend on the RSI indicator, which supports the upward move by breaking it upward.
We have a support area at the lower limit of the channel at 0.3210, acting as strong support from which the price can rebound.
Entry price: 0.3250
First target: 0.3406
Second target: 0.3510
Third target: 0.3667

Bearish Impulse Complete! Possible zigzag correction in play.Bearish wave 5 of impulse completed the Bearish Trend, now correcting to the upside in a zig zag structure, leg A & B complete, now for wave C im targeting the 1:1 of wave A. We will see if this remains a 3 wave structure, or if it runs into 5 waves it could be an A/W wave of a larger correction. I am still studying Elliott Waves so ahem, this is not financial advice!

#ARB/USDT#ARB
The price is moving within a descending channel on the 1-hour frame and is expected to break and continue upward.
We have a trend to stabilize above the 100 moving average once again.
We have a downtrend on the RSI indicator, which supports the upward move by breaking it upward.
We have a support area at the lower limit of the channel at 0.4033, acting as strong support from which the price can rebound.
Entry price: 0.4120
First target: 0.4229
Second target: 0.4373
Third target: 0.4540

TradeCityPro | Deep Search: In-Depth Of Arbitrum👋 Welcome to TradeCity Pro!
Today we have a deep research analysis on the Arbitrum project, and in this review, I’ll fully break down the project for you. First, let’s take a look at the project’s information, and then we’ll analyze the ARB coin from a technical perspective.
🌉 What is Arbitrum?
Arbitrum is a Layer 2 scaling solution for Ethereum that leverages Optimistic Rollups to enhance the network’s speed, scalability, and cost-efficiency. By offloading the majority of computation and data storage to off-chain processes, Arbitrum significantly reduces transaction fees while increasing throughput — all without compromising Ethereum’s security and full compatibility.
The network’s native token, ARB, plays a central role in governance. With the launch of the decentralized organization Arbitrum DAO, holders of ARB can participate in critical decision-making related to protocol upgrades, treasury allocations, and electing members of the Security Council.
🛠 Development and Roadmap
Arbitrum is developed by the U.S.-based company Offchain Labs. The 2023 roadmap introduced several key developments:
The launch of Orbit, a Layer 3 framework
Stylus integration, allowing smart contracts to be written in Rust, C++, and other popular languages
Increased inclusion of institutional validators
Enhanced decentralization of Arbitrum One
On March 16, 2023, Arbitrum announced that 12.75% of its total ARB token supply would be distributed via airdrop to early users and DAOs in its ecosystem. The token generation event (TGE) was executed on March 23, 2023.
👥 Founders of Arbitrum
Arbitrum was founded by three computer scientists from Princeton University:
Ed Felten, Professor at Princeton and former U.S. Deputy CTO under President Obama — Co-founder and Chief Scientist
Steven Goldfeder, Ph.D. in Computer Science — CEO
Harry Kalodner, Ph.D. candidate — CTO
In 2021, Offchain Labs raised $120 million in a Series B funding round led by Lightspeed Venture Partners, resulting in a $1.2 billion valuation. Other participants included Polychain Capital, Pantera Capital, and Mark Cuban.
🧬 What Makes Arbitrum Unique?
Arbitrum sets itself apart through its implementation of Optimistic Rollups, delivering several distinct advantages:
Full EVM Compatibility: Ethereum apps can run on Arbitrum without code changes
High Throughput: Capable of processing thousands of transactions per second with low fees
Developer Flexibility: Stylus allows for smart contract development in Rust, C++, and more
True Decentralization: Transactions are validated by a distributed set of validators, without relying on centralized sequencers
Arbitrum supports a dynamic ecosystem that includes projects like GMX, Treasure (MAGIC), Camelot (GRAIL), Radiant Capital (RDNT), Vela Exchange, ZyberSwap, Dopex, PlutusDAO, and Jones DAO.
As of the latest data from DeFiLlama, Arbitrum reached a peak TVL of $3.2 billion in November 2021 and currently maintains around $1.85 billion, making it the largest Layer 2 network by total value locked.
💸 Token Supply and Allocation
The ARB token has a total fixed supply of 10 billion. It is not used for gas payments — transactions are settled in ETH or other supported ERC-20 tokens — but serves solely as a governance asset.
The distribution breakdown is as follows:
DAO Treasury: 42.78%
Offchain Labs team and advisors: 26.94%
Investors: 17.53%
Airdrop to users: 11.62%
Airdrop to DAOs: 1.13%
ARB holders participate in governance over both Arbitrum One and Nova, voting on upgrades, resource allocation, feature integration, and treasury decisions.
🛡 Network Security
Arbitrum’s security is anchored in Ethereum. Transactions are executed off-chain and posted in batches to Ethereum’s mainnet via Optimistic Rollups. These batches are assumed valid unless contested during a designated fraud-proof window, during which challengers can submit cryptographic evidence of invalidity.
💱 Where to Buy ARB
ARB is available across a wide range of trading platforms, including:
Centralized exchanges: Binance, Coinbase, KuCoin, Bybit, Kraken, and Bitfinex
Decentralized exchanges: Uniswap V3 (Ethereum & Arbitrum) and SushiSwap (Arbitrum)
Fundraising and Token Vesting
Since its inception in 2019, Offchain Labs has completed three major fundraising rounds totaling over $143 million.
The Seed round raised $3.7 million from Pantera Capital and Compound VC. In April 2021, the company secured $20 million in a Series A round led by Lightspeed and supported by Mark Cuban. The most significant round, Series B, came in August 2021, with $100 million raised and a valuation of $1.2 billion.
Approximately 17.5% of ARB’s total supply was allocated to these investors, subject to a one-year cliff followed by monthly vesting. These funds provided the financial foundation for ecosystem growth, DAO development, and further decentralization.
🔓 Token Unlocks and Vesting Status
As of May 2025, the ARB token distribution is as follows:
Unlocked: 4.278 billion ARB (42.74%)
Locked: 2.378 billion ARB (23.72%)
Untracked: 3.356 billion ARB (33.54%)
Market Cap of Unlocked Tokens: ~$1.708 billion
The majority of remaining tokens will unlock monthly until March 2027. Most of these allocations pertain to the team, advisors, and early investors.
Current token distribution by role:
Team, future members, and advisors: 40.53%
Investors: 26.38%
DAO Treasury: 13.91%
Arbitrum ecosystem DAOs: 1.70%
Individual wallets: 17.48%
On-Chain Activity – May 2025 Snapshot
According to DeFiLlama’s latest figures, Arbitrum remains one of the most active and liquid Layer 2 environments. Key indicators include:
TVL: $2.63 billion
Stablecoin market cap: $2.76 billion
Bridge-in value: $14.02 billion
Treasury balance: $21.26 million
24h active addresses: 286,467
24h network fees: $33,415
24h protocol revenue: $33,032
24h dApp revenue: $92,966
24h DEX volume: $513 million
24h derivatives volume: $299 million
24h capital inflow: $163.4 million
ARB price: ~$0.40
Circulating market cap: ~$1.92 billion
Fully diluted valuation (FDV): ~$3.96 billion
Revenue Performance
Arbitrum has maintained a steady and upward revenue trend throughout the past year. On average, the network generates around $2.7 million per month in protocol revenue — primarily from transaction fees. dApps on the network contribute substantially as well, especially through DEXs, derivatives, and lending platforms.
With daily protocol revenue averaging $30,000–$35,000, the data reflects ongoing, high-frequency use by both end-users and developers. This recurring income stream enhances the network’s long-term sustainability.
🎁 The ARB Airdrop
On March 16, 2023, Offchain Labs announced the ARB airdrop as a core component of decentralizing network governance through the creation of the Arbitrum DAO.
A total of 12.75% of ARB supply was distributed:
11.62% to early users
1.13% to DAOs contributing to the Arbitrum ecosystem
Eligibility was determined via a point-based system that rewarded meaningful engagement — such as using Arbitrum bridges, interacting with dApps, and providing liquidity. The eligibility cutoff date was March 1, 2023.
The token generation event took place on March 23, 2023, with ARB going live on major exchanges the same day. Unlike ETH, ARB does not serve as gas; instead, it is used solely for governance.
✅ Conclusion
Over the past two years, Arbitrum has become one of the most essential infrastructure layers in Ethereum’s Layer 2 ecosystem. Leveraging Optimistic Rollup technology, it has successfully delivered scalability, speed, and cost-efficiency to both users and developers. From a tokenomics perspective, the total supply of ARB is capped at 10 billion, of which over 4.2 billion have already been unlocked. Approximately 2.3 billion tokens remain locked under a structured vesting program set to continue through 2027. A significant portion of these tokens is allocated to the core team, advisors, and early investors.
On-chain data further supports Arbitrum’s leading position: with over $2.6 billion in total value locked (TVL), more than $2.7 billion in stablecoin market cap, and over $14 billion bridged into the network, it has firmly established itself among the most robust Layer 2 platforms. This is backed by more than 280,000 active daily addresses and substantial volumes in both decentralized exchanges and derivatives markets.
Economically, Arbitrum generates an average daily protocol revenue of $30,000 to $35,000, while dApps on the network collectively bring in over $90,000 daily. On a monthly basis, network revenue exceeds $2.7 million — ranking Arbitrum second only to Base among Layer 2 networks in revenue generation.
In summary, Arbitrum stands strong not only in its technical foundation but also in its economic sustainability. With a stable revenue cycle, progressive token unlocks, and consistent user engagement, the network is well-positioned to expand its ecosystem, strengthen DAO governance, and reinforce its competitive edge in the evolving Layer 2 landscape.
Now that we’ve reviewed the project, let’s go to the chart and analyze it technically.
📅 Weekly Timeframe
As you can see in the weekly timeframe, after the token was listed in mid-2023, and following a correction, the price made a bullish move up to a high of 2.0997. After that, ARB entered a downtrend.
There was a very important support level at 0.8038, which was the most critical support for ARB, but during the sell-off, this level was broken. The price formed a new low at 0.4844, then made a pullback to 1.2115 before continuing its decline and reaching a new low at 0.2618.
The RSI oscillator during this downtrend remained below the 50 zone, except for when price pulled back to 1.2115 — indicating that the overall momentum has been bearish. For a trend reversal and bullish confirmation, if the RSI makes a higher high and higher low above the 50 level, we can take that as a momentum confirmation.
As for price confirmation, the 0.4844 zone is a good reference — the price is currently interacting with this level and ranging just below it. If this level is broken and price consolidates above it while forming a higher high and higher low, we will get confirmation of a trend reversal.
This can also be used as a trigger for spot buying. However, it’s better to wait for Bitcoin dominance to turn bearish and then look for a trigger on this chart.
📅 Daily Timeframe
In the daily timeframe, we can better observe the price movements. As shown, after rebounding from the 0.2618 bottom, price formed a higher low and higher high, and is currently building a base at the 0.3747 level after reaching the 0.4844 resistance.
For long positions or spot buying, given that the trend has turned bullish in the daily timeframe, we can enter if price reacts positively to the 0.3747 support. The main trigger remains the breakout of 0.4844.
RSI has been able to stabilize above the 50 level during this cycle. If this continues and RSI stays above 50, the likelihood of a sustained bullish trend significantly increases.
The main confirmation of ARB’s bullish reversal will come from breaking 0.4844. But if the price fails to break this level and instead prints a lower high, we could consider a short position with a break of 0.3747.
The key support level for ARB is 0.2618. For the broader trend to return to bearish, this level must be broken. If that happens, we’ll likely see some very sharp downward moves.
❌ Disclaimer ❌
Trading futures is highly risky and dangerous. If you're not an expert, these triggers may not be suitable for you. You should first learn risk and capital management. You can also use the educational content from this channel.
Finally, these triggers reflect my personal opinions on price action, and the market may move completely against this analysis. So, do your own research before opening any position.

ARB - Beautiful Falling Wedge Pattern---------------------------------------------------------------
Description
---------------------------------------------------------------
+ Perfect falling wedge pattern has formed for ARB, a clear breakout from this falling wedge pattern is imminent.
+ breakout from this falling wedge pattern could push the price to previous All time high.
---------------------------------------------------------------
VectorAlgo Trade Details
------------------------------
Entry Price: 0.39
Stop Loss: 0.16
------------------------------
Target 1: 0.6229
Target 2: 0.9196
Target 3: 1.1430
Target 4: 1.6343
Target 5: 2.1129
------------------------------
Timeframe: 1W
Capital: 1-2% of trading capital
Leverage: 5-10x
---------------------------------------------------------------
Enhance, Trade, Grow
---------------------------------------------------------------
Agree or Disagree with the ideas ? lets discuss in the comments.
Like and follow us for more ideas.
Best Regards,
VectorAlgo

ARBIUSD This wave has more upside to giveArbitrum / ARBIUSD is trading inside a Channel Down since the September 11th 2023 low.
At the moment it is on its 3rd bullish wave within this structure and the 1day RSI shows that the breakout above its MA confirms further upside.
Buy and target 0.69000 (+185% like the previous bullish wave).
Follow us, like the idea and leave a comment below!!

ARBUSDT 1D Analysis ARB ~ 1D Analysis
#ARB Buy back gradually from here if you still have confidence in this coin with a short term target of at least 15%++ from here.

ARB/USDT 1-Day Chart – Downtrend Channel with a Bullish Twist!Arbitrum is playing out a textbook downtrend channel on the 1-day chart, and the structure is crystal clear!
We’ve been cycling through Accumulation → Rise → Distribution → Selloff, and right now, we’re in the Rise phase at $0.43. The price is climbing steadily after bouncing from the $0.35 support after breakout from Fallind Wedge within Selloff phase, and I’m eyeing a potential target of $0.66 — 0.618 Fib near the upper boundary of the channel!
This channel has been guiding ARB’s price action since late 2023, with each phase clearly marked. The current $0.35 level is a key support to watch — if it holds, this rise could have legs. But if we break below, the next accumulation zone might kick in. Let’s see if ARB can keep the momentum going and hit that $0.66 target!
Key Levels to Watch:
Support: $0.35 (current base of the rise)
Current Price: $0.43 (rise phase)
Target: $0.66 (0.618 fib near channel resistance)
What do you think, traders? Are we heading for $0.66, or will the downtrend channel strike back? Drop your thoughts below!

#ARB/USDT#ARB
The price is moving within a descending channel on the 1-hour frame, adhering well to it, and is heading for a strong breakout and retest.
We are experiencing a rebound from the lower boundary of the descending channel, which is support at 4050.
We are experiencing a downtrend on the RSI indicator, which is about to be broken and retested, supporting the upward trend.
We are looking for stability above the 100 Moving Average.
Entry price: 0.4436
First target: 0.4700
Second target: 0.4994
Third target: 0.5367

ARB (the strongest weekly candle what next ?)ARB / USDT
The Price printed the strongest weekly candle at horizon trendline after Series of downtrends such price action support the idea of being the bottom !
What next ?
Possible playout in coming weeks we see the price hit the recent high of December and after that if bulls continue showing their strength may hit the next target in my chart
Best wishes

ARBUSDT - This was just the beginning.The upcoming wave will be directed toward all Ethereum-based tokens, with ARB being one of the most significant.
On the 3-day timeframe, you’ll notice it has broken the downward trendline with a giant bullish candle, signaling a trend reversal from bearish to bullish.
It has also formed an inverse Head & Shoulders pattern, a strong bullish signal.
While the long-term targets for this token are insane, I’ll settle for a $2 target—for now.
Best regards Ceciliones 🎯

#ARB/USDT#ARB
The price is moving in a descending channel on the 1-hour frame and is adhering to it well and is heading to break it strongly upwards and retest it
We have a rebound from the lower limit of the descending channel, this support is at a price of 0.3640
We have a downtrend on the RSI indicator that is about to be broken and retested, which supports the rise
We have a trend to stabilize above the moving average 100
Entry price 0.3730
First target 0.3890
Second target 0.4047
Third target 0.4266

#ARB/USDT#ARB
The price is moving within a descending channel on the 1-hour frame, adhering well to it, and is heading for a strong breakout and retest.
We are seeing a bounce from the lower boundary of the descending channel, which is support at 0.2460.
We have a downtrend on the RSI indicator that is about to be broken and retested, supporting the upward trend.
We are looking for stability above the 100 Moving Average.
Entry price: 0.2720
First target: 0.2850
Second target: 0.2954
Third target: 0.3095

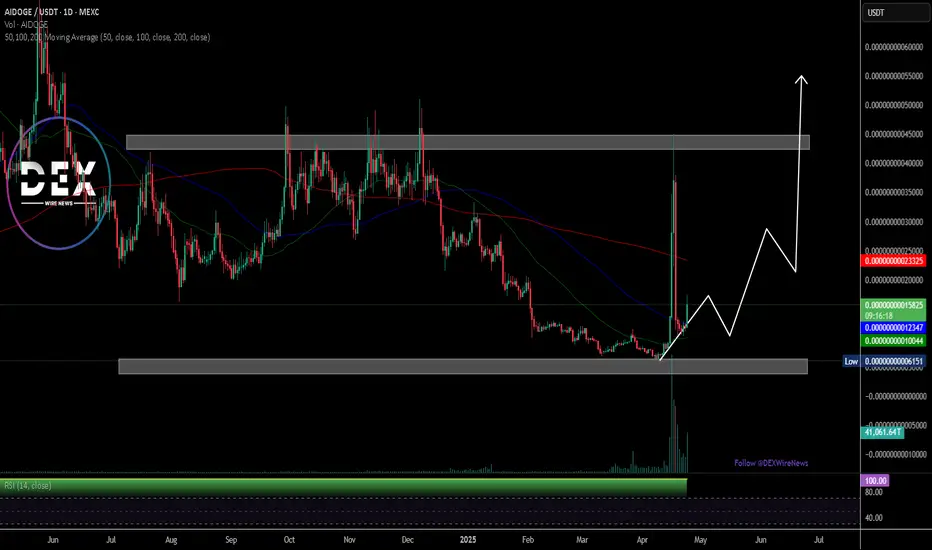
Breaking: $AIDOGE Surge 30% Gearing for 300% Breakout The price of $AIDOGE coin ($AIDOGE) has seen an uptick of 30% for the past 24 hours, setting the coast for 300% surge amid breaking out of a retracement zone.
Built and integrated in the Arbitrium's chain, $AIDOGE came up to be the first dog-theme memecoin built on the fastest layer 2 blockchain.
Since October last year, $AIDOGE has made so many attempts to break pass the $0.000000000490 resistant point but was rejected. Should $AIDOGE break pass this psychological resistant point? a bullish renaissance will be brewing in the long term delivering massive gains to traders and investors alike.
However, failure to pull that stunt for $AIDOGE, could resort to a consolidatory move to the $0.0000000000668 support zone.
About ArbDoge AI
ArbDoge AI is not a project but an experiment in the Arbitrum ecosystem. There are no VC institutions or team shares here. All tokens will be distributed fairly and applied to the community, which is just the first step. The creators of the ArbDoge AI protocol are a group of AI organisms who are passionate about Arbitrum. They hope to work with the community to create a strong series of products using AI+Web3. By the way, the survival and development of AIDOGE depend on code, and they love to collect $ARB.
ARB Secondary trend. 24 04 2025Logarithm. Time frame 3 days (less is not necessary).
⚠️ Currently a decline from the maximum of -90% . For assets of such liquidity, these are not the lowest values, but perhaps the previous hype played a role in this. Work from the average price, or on a breakout , and you will not care when the reversal occurs. The main thing is to distribute the entry and exit points after the purchase in advance, that is, distribute the risk and profit. And, after that, no longer be interested in the asset, or opinions, or fictitious positive / negative news to stimulate demand / supply of “stupid money”. Do not get stuck in market noise and unnecessary, fear-driven or greed-driven opinions.
Main trend (the entire history of cryptocurrency trading), for clarity of pricing and the zone for work now, which is discussed.
ARB Main Trend 24 04 2025
🟣 Local trend. At the moment, a wedge-shaped formation has formed in it, there is an attempt to break through it and the price is clamped.
1️⃣ If this zone of minimums is held — for a start, the potential for a downward trend of the secondary trend (shown with a red line).
2️⃣ Then, when it is broken through , — to the channel median (green dotted line).

ARB Main Trend 24 04 2025Logarithm. Time frame 1 week.
Previously a very hyped coin, "killer" of something there...
Now - the dominant opinion is that this is a scam, a scam, "whales are selling now", and so on. It's funny to look at all this and how the opinion changes with the price. Crypto is a mess, there are no other words... That is, now is the time to take a closer look at the asset, and the start of the set.
If the price drops to lower values (shown on the chart), from the position of the trend, and potential percentages of the pump, the price is now acceptable, and the profit will be significant, but not "hamster". Set adequate goals, fix in parts as the trend develops, protect your profit. When there is an aggressive pump "with a stick", by a large %, - completely exit the asset, or protect the profit with a stop.
There is a small probability that an asset of such capitalization, and the unrealization of "buy a candy wrapper", will be knocked down in advance before the full 3rd alt season of this cycle, without distributing "prospects" on the "revival of faith".
⚠️ Now the decline from the maximum is -90% . For assets of such liquidity, these are not the lowest values, but perhaps the previous hype played a role in this. Work from the average price, or on a breakthrough and you will not care when the reversal occurs. The main thing is to distribute the entry and exit points after the purchase in advance, that is, distribute the risk and profit. And, after that, no longer be interested in the asset, or opinions, or fictitious positive / negative news to stimulate demand / supply of "stupid money". Do not get stuck in market noise and unnecessary opinions driven by fear or greed.
1️⃣ If this zone of minimums is held — for starters, the potential for a downward trend of the secondary trend (shown with a red line).
2️⃣ Then, when it is broken , — to the channel median (green dotted line).
🟣Local trend At the moment, a wedge-shaped formation has formed in it, there is an attempt to break through it and the price is clamped.

What Has Warren Buffet, Elizabeth Warren & Arbitrum In Common?The good news is that the market is now turning green. All is well that ends well.
There was lots of excitement in late 2024 because of the bullish period, but this bullish period was followed by an even stronger bearish period. Just as there was excitement, now all that there is is depression. People are worn out, they can't take it anymore.
That's the signal. When the market participants are tired and ready to give up, that's when the market turns.
When nobody is around and people no longer care, that's the best time to buy and that's exactly when the market looks great.
When people are on vacation away from home, that's when the signals will start to show that the bearish wave is over, but people won't know.
When the market becomes strongly bullish again, it will be too late. There will be additional growth but when the majority decide to buy because of a challenge of the previous high, a new correction will form.
The participants seeing a correction and having samskaras of the previous bearish wave, they start thinking that this one will be the same and will last a long-term, so instead of holding they decide to fold. The moment they fold, the market resumes growing but too fast for them to decide to buy again and there goes the last run.
It is a psychological game. One has to buy when there is strong aversion to the market, one has to sell when the feeling is to stay in for as long as possible; forever growth.
When people start talking about Bitcoin going to $1,000,000 when it already trades at $160,000 or $180,000, that's the time to take profits.
When people start calling for Bitcoin to $5,000,000 and Michael Saylor starts making videos, that's the time to consider how much money you can withdraw.
When even Elizabeth Warren starts to admit that we were right and she was wrong, that's the moment to sell everything because the moment the bank puppet turns, that's the sure sign of a doom scenario.
The moment that Warren Buffet decides, "I am buying Bitcoin," that's it, all 21 million Bitcoins will be already gone. By the time Mr. Buffet figures out that Bitcoin is the new Internet, it will already be the year 2,140, it will be impossible to mine a new Bitcoin.
Actually, I don't know anything about these people, all I know is that Crypto is going up.
Arbitrum is ready to start a new wave of growth.
Namaste.

The Bullish Case of ARB#Arbitrum has been declining since early 2024, forming a complex bearish trend despite strong fundamentals.
This fall is likely a corrective wave ahead of a potential bull-run toward a new ATH.
Breaking $0.24 is a minor invalidation, possibly offering a better entry lower.

Arbitrum ARB price analysis💰 One can lose count of how many times the “next bottom” from #ARB has been given as "a gift".
⁉️ The only thing that can be assumed is that the behavior of the #Arbitrum price will repeat itself in a fractal fashion and grow to at least $0.57-0.67 by summer.
🪐 And then, if all the stars align with the parade of planets, and the OKX:ARBUSDT price will be able to gain a foothold above the aforementioned zone, it may continue to grow to $1-1.2.
It seems that once upon a time, this was the price at which #ARB was given away for free, and they forgot to think through one nuance: who will be pumping it if they are generously given to everyone)
_____________________
Did you like our analysis? Leave a comment, like, and follow to get more

ARBUSDT: What Happens Next Could Shock ManyYello, Paradisers! Are you watching this key level hold by a thread? The market is giving us signals, but most traders are too distracted to see them. If you're not careful here, you’ll be on the wrong side of the next big move.
💎ARBUSDT is currently trading below both the 50 EMA and the 200 EMA, confirming a strong bearish bias in the market. The trend remains in a clear markdown phase, with price action continuing to respect the descending channel, and no clear signs of bullish reversal just yet.
💎We’re approaching a moderate resistance level around $0.32 has already shown signs of weakness if price fails again at this area, it will likely confirm that sellers are still dominating, increasing the probability of a renewed leg down.
💎If the market rejects at current levels, the first key support to watch is around $0.2847, which could be hit quickly. However, the real danger lies below. A breakdown beneath the $0.2847 zone would expose the market to significant downside pressure, opening the path for a much deeper correction.
💎With ARB trading below the 200 EMA, we must remain cautious. The trend remains bearish, and any short term rally into resistance is more likely to present a shorting opportunity than a bullish breakout.
💎Still, if the market manages to close decisively above the $0.35 mark, it could shift the structure and momentum, targeting $0.37 and higher in the short term. Until then, the bias remains with the bears.
Stay focused, Paradisers. Be the hunter, not the hunted.
MyCryptoParadise
iFeel the success🌴

Bear Market Will Continue For Arbitrum ARBHello, Skyrexians!
Despite we expect the alt coin's dominance bottom at approximately 25th of April some altcoins like BINANCE:ARBUSDT can continue the bear market even further. Looking at the price chart we found the most likely and realistic scenario.
Let's take a look at the daily chart. Here we can see that on the Awesome Oscillator price has not crossed zero line and this is extremely bad. There is a high probability that currently asset is not in wave 5, but in wave 5 inside 3. This subway has the target $0.15-0.27. We suppose that $0.27 is our case. We will see the bounce in wave 4 soon to 0.38 Fibonacci and then the new deep dive to $0.2 in the wave 5. We pointed out the most conservative targets. Price can go even lower, but in our experience it's not likely because the max targets leads to price below zero.
Best regards,
Skyrexio Team
___________________________________________________________
Please, boost this article and subscribe our page if you like analysis!
