Fibonacci Arcs in Stock TradingFibonacci Arcs in Stock Trading
Fibonacci arcs, derived from the renowned Fibonacci sequence, offer a compelling blend of technical analysis and market psychology for traders. By mapping potential support and resistance areas through arcs drawn on stock charts, these tools provide insights into future price movements. This article delves into the practical applications of Fibonacci arcs in trading, their interplay with market psychology, and best practices for effective use.
Understanding Fibonacci Arcs
The Fibonacci arc indicator is a unique tool in technical analysis derived from the famed Fibonacci sequence. It’s crafted by drawing arcs at the key Fibonacci retracement levels - 38.2%, 50%, and 61.8% - from a high to a low point on a stock chart. Each curve represents potential support or resistance areas, offering insights into the stock’s future movements.
The art of arc reading, meaning interpreting these curves, is crucial for traders. When a stock approaches or intersects with an arc, it reflects a significant reaction level. For instance, if a stock price touches or nears an arc, it could face arc resistance, indicating a potential halt or reversal in its trend.
Applying Fibonacci Arcs in Trading
In the stock market, these arcs serve as a guide for traders seeking to anticipate future price movements. When applied correctly, they can provide critical insights into potential support and resistance levels. Here's a step-by-step look at how you may use them effectively:
- Identifying High and Low Points: Begin by selecting a significant high and low point on the stock's chart. In an uptrend, it’s the most recent swing high to a previous swing low, and vice versa. These are the anchor points.
- Drawing the Arcs: Once the points are selected, draw the arcs at the Fibonacci retracement levels of 38.2%, 50%, and 61.8%. They radiate from the chosen low point to the high point (or vice versa), cutting across the chart.
- Interpretation: Watch how the stock interacts with these lines. When the price approaches an arc, it might encounter resistance or support, signalling a potential change in trend or continuation.
- Timing Entries and Exits: Traders can use the arcs in the stock market as a tool to time their trading decisions. For instance, a bounce could be a signal to enter a trade, whereas the price breaking through might suggest it's time to exit.
Fibonacci Arcs and Market Psychology
The effectiveness of Fibonacci arcs in trading is deeply intertwined with market psychology. They tap into the collective mindset of traders, who often react predictably to certain price levels. The Fibonacci sequence, underlying this tool, is not just a mathematical concept but also a representation of natural patterns and human behaviour.
When a stock nears a curve, traders anticipate a reaction, often leading to a self-fulfilling prophecy. If many traders make an arc stock forecast, they might sell as the price approaches a certain point, causing the anticipated resistance to materialise. Similarly, seeing support at an arc can trigger buying, reinforcing the tool’s power.
This psychological aspect makes Fibonacci arcs more than just technical tools. They are reflections of the collective expectations and actions of market participants, turning abstract mathematical concepts into practical indicators of market sentiment and potential movements.
Best Practices
Incorporating Fibonacci arcs into trading strategies involves nuanced techniques for better accuracy and efficacy. Here are some best practices typically followed:
- Complementary Tools: Traders often pair this tool with other indicators like moving averages or RSI for a more robust analysis.
- Accurate Highs and Lows: It's best to carefully select the significant high and low points, as the effectiveness of the curves largely depends on these choices.
- Context Consideration: Understanding the broader market context is crucial. Traders usually use Fibonacci arcs in conjunction with fundamental factors to validate their analysis.
- Watch for Confluence: Identifying areas where Fibonacci levels converge with other technical signals can provide stronger trade setups.
- Practice Patience: Traders typically avoid making hasty decisions based solely on Fibonacci levels. It's usually better to wait to see additional confirmation from the price action.
Advantages and Limitations of Fibonacci Arcs
Fibonacci arcs are a popular tool in technical analysis, offering distinct advantages and some limitations in analysing stock movements. Understanding these can help traders leverage the tool more effectively.
Advantages
- Intuitive Nature: The Fibonacci sequence is a natural pattern, making the tool intuitive for traders to understand and apply.
- Dynamic Support and Resistance Levels: They provide dynamic levels of support and resistance, unlike static lines, adapting to changing market conditions.
- Versatility: Effective in various market conditions, the arcs can be used in both trending and sideways markets.
Limitations
- Subjectivity in Selection: The effectiveness largely depends on correctly identifying the significant high and low points, which can be subjective.
- Potential False Signals: Like all technical tools, they can generate false signals, especially in highly volatile markets.
- Requires Complementary Analysis: To maximise effectiveness, these curves are usually used alongside other technical indicators, as they are not infallible on their own.
The Bottom Line
Fibonacci arcs are invaluable tools in stock analysis, providing insights into market trends and potential price movements.
This article represents the opinion of the Companies operating under the FXOpen brand only. It is not to be construed as an offer, solicitation, or recommendation with respect to products and services provided by the Companies operating under the FXOpen brand, nor is it to be considered financial advice.
ARC
ARC Buy/Lonf Setup (1D)The ARC symbol, after completing a triangle and undergoing significant price and time correction, is approaching a strong and important origin.
It is expected that upon reaching the green zone, it will move toward the specified targets.
Since trading this symbol carries its own risks, make sure to practice proper risk management.
The targets are marked on the chart.
A daily candle closing below the invalidation level will invalidate this analysis.
For risk management, please don't forget stop loss and capital management
When we reach the first target, save some profit and then change the stop to entry
Comment if you have any questions
Thank You

ARCUSDT - Bullish Breakout Confirmed ARC has been trading in a well-defined descending channel for several weeks, forming a consistent downtrend. However, the price has now broken out of the channel resistance, signaling a potential bullish reversal.
Descending Channel Breakout: ARC has clearly broken above the channel’s upper trendline, indicating a shift in market structure from bearish to bullish.
Resistance Zone Flipped: The price broke through a recent horizontal resistance zone.
EMA: ARC is now trading above both the 50 EMA and 100 EMA,

ARC dead cat bounce or support... RR is a factorARC is at a very important level. Price action will define support or follow-through for a continuation down. There is a lot of volume at this current price, which can cause volatility. Momentum and trend oscillators are not yet oversold on the daily, which leaves room for more downside.
Full TA: Link in the BIO

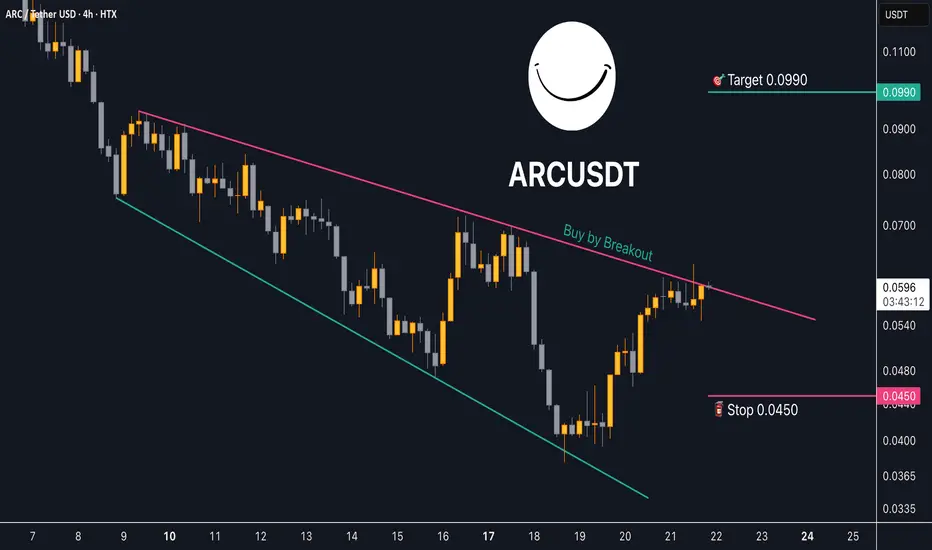
Trading opportunity for AI Rig Complex ARCUSDTBased on technical factors there is a Buy position in :
📊 ARCUSDT
🔵 Buy Now
🪫Stop loss 0.0450
🔋Target 0.0990
📏 R/R 2,7
💸RISK : 1%
We hope it is profitable for you ❤️
Please support our activity with your likes👍 and comments📝
Trading opportunity for ARCUSDTBased on technical factors there is a Buy position in :
📊 ARCUSDT
🔵 Buy Now
🪫Stop loss 0.0310
🔋Target 0.0600
📏 R/R 1,8
💸RISK : 1%
We hope it is profitable for you ❤️
Please support our activity with your likes👍 and comments📝

Bullish Opportunity in ARC (Binance Futures)1. We have structure of the parent model 22
2. We have a run on buyside within the H1 discount lows
3. We have buyside to attack

Can someone help me out with ARC?I'm trying to find out where we are in the elliot wave count. My idea is that we are in wave 5 of wave I. But we keep going up. I want to buy at the bottom of wave 2.

AI Rig Complex: Hidden Gem Or Big Project? 3,000% Target Mapped Here is another "hidden gem" that just caught my attention. The interesting part is the fact that it grew by an astonishing 40,440% between late 2023 and early 2024. Even if we remove the first day of trading which tends to be highly volatile, we get a massive 5,597% growth wave in the pre-bull-market year.
Much of this growth has been corrected after an entire year of bearish action and the doors are open for a new bullish phase. I am seeing some 2500 to 3000% potential, which can be translated into 25-30X. That's what I mean by huge potential for growth.
Would you like to see more hidden gems or would you prefer for me to visit the bigger projects and their trading pairs?
So you are happy, I will do both.
Your support is highly appreciated.
The last bearish wave was a decisive one. ARCUSDT went down fast and strong, a steep decline. The market will balance this out with a huge and prolonged rise. The faster the crash, the deeper a pair goes, the stronger the bullish wave that follows.
AI Rig Complex is getting ready for massive growth.
This is a hidden gem now but not for too long. This one is likely to become part of the big projects in the coming months.
The Altcoins market is about to blow up.
Make sure to be in, to be present and focused.
Make sure to make the most of this opportunity because once it is over, it is gone for a long time.
We are early this time around and experience is in our side.
Everything is converging to give us the opportunity to achieve financial freedom and success.
Are you going to take this opportunity and make the most of it?
Are you going to let it fade away?
Let's take it.
You have my support.
Thank you!
Your support is appreciated.
Namaste.

ARC analysis (4H)From the point where we placed the red arrow on the chart, it seems that ARC's correction has begun.
Based on the correction, a 3D pattern appears to be forming, with the third drive potentially completing in the green zone, where we can look for buy/long positions.
In this area, upon receiving a trigger, sell/short positions can also be considered.
For risk management, please don't forget stop loss and capital management
Comment if you have any questions
Thank You

ARCUSDT 3DARC ~ 3D
#ARC In Time Frame 3D, It still maintains this support block. Buy from here if you still have Conviction on this coin with a minimum target of 20%+

Is ARCUSDT Gearing Up for a Breakout?Yello, Paradisers! #ARCUSDT has been regaining strength after a corrective phase, showing promising signs of a rebound. Recently, the price formed a double bottom, a bullish pattern that often signals a trend reversal. Momentum is building as the price begins to break above this key structure, setting the stage for a critical test ahead.
💎The spotlight now is on a descending resistance at $0.04120, which has consistently capped #ARC’s upside potential. A breakout above this level could be the game-changer bulls are waiting for, paving the way for a bullish rally targeting $0.0510 to $0.0540. These levels align with moderate resistance zones and the double bottom's projected pattern target, where profit-taking might emerge.
💎If the bullish momentum remains strong, ARC could aim even higher, testing the next major resistance around $0.0630 to $0.0650. This range represents a robust supply zone that traders should keep on their radar.
💎On the downside, the neckline breakout level at $0.0370 to $0.03550 is a critical support zone. Any retest here is likely to attract significant buying interest, bolstered by the protective cushion of the EMA-200 and EMA-100. This confluence adds an extra layer of confidence for bulls preparing for the next move.
Patience and discipline are key here, Paradisers. The market often tests both bulls and bears before making decisive moves, so stay vigilant.
MyCryptoParadise
iFeel the success🌴


ARC - PlanARC see you at $0.23. $0.23 is my first target to take some profits. But I do believe we will go higher

ARC - Reversal soonARC AI - I'm expecting this coin to bounce here soon after bouncing form 0.75 fib level


ARC - Resistance getting weakerThe more times we hit the resistance here the weaker it will get. Short term target anywhere between 0.11 - 0.22 cents. ARC/USDT

ARC reversalARC has already made a short reversal from the 0.75 Fib level. It is set for further upward momentum. Keep an eye on ARC as it regains strength! - ARC / USDT

ARCUSDTARC ~ 3D Update
#ARC Buy order price reached. If you have Conviction on this coin, This is the right time to start buying again.


ARCUSDTARC ~ 1W
#ARC This coin has fallen around -90% from its highest price.
this is a very interesting support block to consider buying back for at least 20%+ short term

ARC might do a bit lower before strong next leg upPretty easy setup. If it bounces off 3.618, vamanos. To be monitored with super close stop for maximizing lever.
Either way 8.236 (or more) is the ultimate target for later
---
If you like my content, if it helps you gain profit, give it a like!
Thanks!
---
Hold my beer pls
----
No financial advice, do your own research, don't be stupid

ARC is consolidating before continue its uptrendNYSE:ARC is low-mid size token by market cap which should be in your portfolio if you searching for good #AI projects. By @DeFi_ARC recent AMA, they are going to deploy ARC reactor which should compete with #GPT4 ! This is huge!
Team is active, some crypto twitter influencers which has good reputation like @CryptoWizardd and others are also supporting this project. Price is having a retrace , good moment for an entry now!
Market cap is 94M at the moment 💎💎💎💎
