ARKK: The Calm Before the Innovation Storm -ALTSEASON Is COMING🚀 ARKK: The Calm Before the Innovation Storm 🌪️
The markets are shifting, and disruption is about to go vertical. ARK Innovation ETF (ARKK) is quietly positioning itself for what could be the most explosive move of this decade. With high-conviction bets in AI, Bitcoin, genomics, and next-gen tech, this isn’t just a fund—it’s a launchpad for exponential growth.
This post breaks down exactly why ARKK could go parabolic—and why the smart money is already moving in. 👇
Explosive upside in 2026
ARKK is already up over 24% YTD , showing strong momentum compared to broader markets and signaling early stages of a potential parabolic move .
High-conviction concentration in game-changers
Top 10 holdings include Tesla, Roku, Zoom, Coinbase, UiPath, Block, Crispr Therapeutics, DraftKings, Shopify, and Exact Sciences. These are leaders in innovation sectors with massive upside potential .
Deep exposure to Bitcoin and digital assets
Heavy allocation to Coinbase and Block gives indirect exposure to Bitcoin . If BTC breaks into a new cycle high , ARKK stands to benefit significantly.
Positioned in exponential growth sectors
Focus on AI, genomics, EVs, fintech, robotics, and blockchain , all of which are entering accelerating adoption phases globally.
Aggressive smart-money accumulation
Cathie Wood’s team continues buying aggressively during dips, reinforcing institutional confidence in the fund’s long-term trajectory.
Technical breakout structures forming
Ascending triangle and multi-month consolidation breakouts suggest a technical setup primed for explosive upside .
Innovation supercycle aligning
ARKK's themes are aligned with major global shifts like de-dollarization, decentralized finance, and AI convergence .
High beta = massive upside leverage
With a beta above 2 , ARKK tends to outperform in bull runs , offering leveraged exposure to innovation without the need for margin.
Resurgence of top holdings
Names like Coinbase, Tesla, Shopify, and Roku are up 50%–100% YTD , driving ARKK’s NAV growth and fueling bullish sentiment .
Long-term vision with short-term catalysts
The fund projects 5x returns over the next five years , while Bitcoin halving cycles, tech innovation, and regulatory clarity serve as short-term ignition points .
Marty Boots | 17-Year Trader — smash that 👍👍, hit LIKE & SUBSCRIBE, and share your views in the comments below so we can make better trades & grow together!
ARK

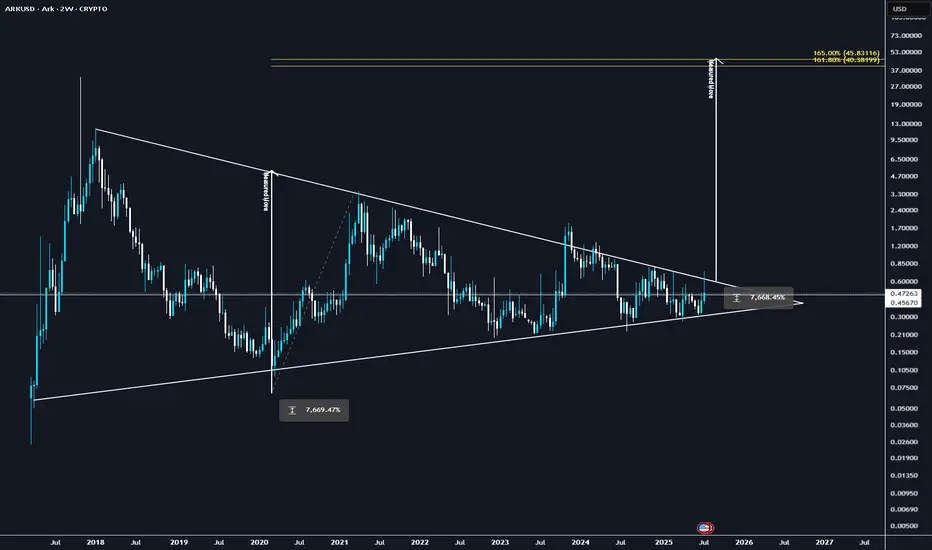
ARK: 100x in the makingMulti year compression, this is simply one of the best set ups in crypto today.
Heavy volume & sharp price moves
ARK didn’t just move—it ripped ~75% in one swing, with daily volume pushing $6–7M. Weekly upside is outpacing the market, classic sign of real demand coming in.
ARK’s more than a meme—it’s built on Delegated Proof of Stake (DPoS), with forging delegates, fast blocks, and governance on-chain. Utility’s there to support a legit move if adoption increases.
Alt season is underway. ARK’s strength isn’t just tagging along—it’s showing independent bullish structure with real volume behind it.
ARK’s showing proper strength—strong volume, clean technical structure, ecosystem fundamentals, and broad altcoin momentum.
ARKUSDT Forming Bullish PennantARKUSDT is beginning to attract significant attention from traders and investors as fresh buying momentum pushes this pair into the spotlight. With a strong base forming and a healthy increase in volume, ARKUSDT shows signs of strength that could translate into a substantial upside move. Technical traders are watching closely for a breakout above the recent consolidation range, which could easily set the stage for a 40% to 50%+ gain in the coming weeks. The growing interest in this project signals that more participants are positioning themselves for a potential bullish run.
Market sentiment around ARKUSDT is improving as investors look for promising altcoins with solid fundamentals and an active community. The crypto market often rewards early movers, and ARK’s chart structure hints at a possible trend reversal. This pair has managed to hold key support levels with confidence, suggesting that buyers are stepping in to defend the zone and accumulate before the next leg higher. A clean breakout above resistance could invite new capital flows, pushing prices toward the projected target range.
The volume profile for ARKUSDT is another encouraging factor, confirming that the recent price movements are backed by genuine market interest rather than just speculative spikes. This is crucial for sustainability and follow-through, as consistent volume can fuel a steady climb. As altcoins start to gain traction alongside major pairs like BTC and ETH, ARKUSDT stands out as one of the notable opportunities for traders seeking medium-term gains.
✅ Show your support by hitting the like button and
✅ Leaving a comment below! (What is You opinion about this Coin)
Your feedback and engagement keep me inspired to share more insightful market analysis with you!

Circle Collapse - Will COIN follow? Circle stock has been on a wild ride lately
After a meteoric rise of over 700% since its IPO on June 5, it's now facing some turbulence:
- Today, the stock dropped nearly 16%, partly due to Cathie Wood’s ARK Invest selling $110 million worth of shares.
- Analysts are also sounding caution. Compass Point initiated coverage with a $205 price target—below its current trading price—citing rising competition in the stable coin space.
- Despite the dip, some still see long-term potential. A recent Forbes analysis explored whether Circle could hit $500 per share, driven by growth in USDC reserves and infrastructure revenue.

ARKUSDT(Ark) Updated till 17-02-25ARKUSDT(Ark) Daily timeframe range. for low volume and retail interest from this kind of alt very easy to find good R:R setups for day traders. failed to close above 0.5587 will push the price down to 0.3636. it will retrace back if stays above 0.5587.

ARKUSDT: A Green Beacon in a Red Sea? ARKUSDT: A Green Beacon in a Red Sea? 💹
While everything else seems to be sinking, ARKUSDT stands a chance to stay green. However, let’s not get overly optimistic just yet. The green box below is a potentially safer entry zone , depending on market conditions.
Here’s the game plan:
Green Box: A solid area for entries if the market aligns.
Confirmation Required: Always wait for low time frame (LTF) structure breaks before making a move.
Stay sharp, manage your risk, and let the charts guide you. Boost, comment, and follow for more trading insights! 🚀
Let me tell you, this is something special. These insights, these setups—they’re not just good; they’re game-changers. I've spent years refining my approach, and the results speak for themselves. People are always asking, "How do you spot these opportunities?" It’s simple: experience, clarity, and a focus on high-probability moves.
Want to know how I use heatmaps, cumulative volume delta, and volume footprint techniques to find demand zones with precision? I’m happy to share—just send me a message. No cost, no catch. I believe in helping people make smarter decisions.
Here are some of my recent analyses. Each one highlights key opportunities:
🚀 GMTUSDT: %35 FAST REJECTION FROM THE RED BOX
🎯 ZENUSDT.P: Patience & Profitability | %230 Reaction from the Sniper Entry
🐶 DOGEUSDT.P: Next Move
🎨 RENDERUSDT.P: Opportunity of the Month
💎 ETHUSDT.P: Where to Retrace
🟢 BNBUSDT.P: Potential Surge
📊 BTC Dominance: Reaction Zone
🌊 WAVESUSDT.P: Demand Zone Potential
🟣 UNIUSDT.P: Long-Term Trade
🔵 XRPUSDT.P: Entry Zones
🔗 LINKUSDT.P: Follow The River
📈 BTCUSDT.P: Two Key Demand Zones
🟩 POLUSDT: Bullish Momentum
🌟 PENDLEUSDT.P: Where Opportunity Meets Precision
🔥 BTCUSDT.P: Liquidation of Highly Leveraged Longs
🌊 SOLUSDT.P: SOL's Dip - Your Opportunity
🐸 1000PEPEUSDT.P: Prime Bounce Zone Unlocked
🚀 ETHUSDT.P: Set to Explode - Don't Miss This Game Changer
🤖 IQUSDT: Smart Plan
⚡️ PONDUSDT: A Trade Not Taken Is Better Than a Losing One
💼 STMXUSDT: 2 Buying Areas
🐢 TURBOUSDT: Buy Zones and Buyer Presence
🌍 ICPUSDT.P: Massive Upside Potential | Check the Trade Update For Seeing Results
🟠 IDEXUSDT: Spot Buy Area | %26 Profit if You Trade with MSB
📌 USUALUSDT: Buyers Are Active + %70 Profit in Total
🌟 FORTHUSDT: Sniper Entry +%26 Reaction
🐳 QKCUSDT: Sniper Entry +%57 Reaction
📊 BTC.D: Retest of Key Area Highly Likely
This list? It’s just a small piece of what I’ve been working on. There’s so much more. Go check my profile, see the results for yourself. My goal is simple: provide value and help you win. If you’ve got questions, I’ve got answers. Let’s get to work!

ARKUSDT: What Every Trader Needs to Know Right Now - Ark◳◱ On the BINANCE:ARKUSDT chart, the Trendline Touch pattern suggests momentum building up for a significant move. Traders might observe resistance around 0.7765 | 0.9164 | 1.1786 and support near 0.5143 | 0.392 | 0.1298. Entering trades at 0.5201 could be strategic, aiming for the next resistance level.
◰◲ General Information :
▣ Name: Ark
▣ Rank: 531
▣ Exchanges: Binance, Gateio, Mexc, Hitbtc
▣ Category / Sector: Infrastructure - Interoperability
▣ Overview: None
◰◲ Technical Metrics :
▣ Current Price: 0.5201 ₮
▣ 24H Volume: 3,361,359.843 ₮
▣ 24H Change: 1.9%
▣ Weekly Change: -17.63%%
▣ Monthly Change: -9.08%%
▣ Quarterly Change: 5.33%%
◲◰ Pivot Points :
▣ Resistance Level: 0.7765 | 0.9164 | 1.1786
▣ Support Level: 0.5143 | 0.392 | 0.1298
◱◳ Indicator Recommendations :
▣ Oscillators: BUY
▣ Moving Averages: SELL
◰◲ Summary of Technical Indicators : NEUTRAL
◲◰ Sharpe Ratios :
▣ Last 30 Days: -0.71
▣ Last 90 Days: 0.42
▣ Last Year: -0.05
▣ Last 3 Years: 0.27
◲◰ Volatility Analysis :
▣ Last 30 Days: 0.99
▣ Last 90 Days: 1.31
▣ Last Year: 1.19
▣ Last 3 Years: 1.19
◳◰ Market Sentiment :
▣ News Sentiment: N/A
▣ Twitter Sentiment: N/A
▣ Reddit Sentiment: N/A
▣ In-depth BINANCE:ARKUSDT analysis available at TradingView TA Page
▣ Your thoughts matter! What do you think of this analysis? Share your insights in the comments below. Your like, follow, and support are greatly valued and help sustain high-quality content.
◲ Disclaimer : Disclaimer
The content provided is for informational purposes only and does not constitute financial, investment, or trading advice. Always conduct your own research and consult a qualified professional before making any financial decisions. Use of the information is solely at your own risk.
▣ Explore the Power of Charting with TradingView
Unlock a wide range of financial analysis tools, data, and features to elevate your trading experience. Take a tour and see the possibilities. If you decide to upgrade your plan, you can receive up to $30 back. Discover more here - affiliate link -

ARK ANALYSIS (4H)From where we placed the red arrow on the chart, the ARK correction has started. An ABC appears to be completed.
Now the price has entered the bullish phase.
It looks like we are now entering a wave D or a bullish pattern.
The demand range is our rebuy range.
The targets are marked on the chart.
Closing a daily candle below the invalidation level will violate the analysis.
For risk management, please don't forget stop loss and capital management
When we reach the first target, save some profit and then change the stop to entry
Comment if you have any questions
Thank You


ARKUSDT Nears Breakout ZoneARKUSDT Technical Analysis update
ARKUSDT has been trading within a broadening wedge pattern for the past 375 days. The price is now moving toward the wedge resistance line, signaling a potential breakout. A breakout can be confirmed once the daily candle closes above the resistance line. There has been a rise in volume near the resistance, and the price is trading above the 100 and 200 EMAs, which is considered a bullish sign for ARK.
Regards
Hexa

ARKUSDT (Ark) Updated till 16-10-24ARKUSDT (Ark) Daily timeframe range. PA trying to push through 0.6058 a daily clean close can confirm it. if sellers dont overcome it can push further. recent support at 0.4128.

Full Done: #ARKM More Than 100% , #ARK 30 % From Entry Full Done: #ARKM More Than 100% , #ARK 30 % From Entry ...
DM me for timely all alt coins analysis. We can't update here time to time.
$ Jai Shree Ram $
@NAMASTE@

ARKUSDT (Ark) Updated till 06-10-24ARKUSDT (Ark) Daily timeframe range. this thing got way much space to move around. if market gets more money flow there are potential of good setups. devs are doing not that much all the doing done by retail. for now support at 0.3690 if it holds it will push further.

ARK || R/R = 3:34Ark (ARK) is a cryptocurrency and a blockchain platform designed to foster an ecosystem of interoperable blockchains. The ARK platform aims to make blockchain technology more accessible and efficient by providing tools and services that simplify the process of creating and deploying decentralized applications (dApps) and blockchain-based products.
News:
Weekly Development Report Released.
Sorry for the missed part of the chart,
SL = 0.6255
TP1 = 1.0401
TP2 = 1.2584
TP3 = 1.6117

ARK Long Setup Setting / Wait for the UpdatesBINANCE:ARKUSDT
COINBASE:ARKMUSD
Hello Traders
💥Long position on ARK
SL1 ---> Low-risk status: 3x-4x Leverage
SL2 ---> Mid-risk status: 5x-8x Leverage
👾The setup is active but expect the uncertain phase as well.
➡️Entry Area:
Yellow zone
⚡️TP:
0.4330
0.4420
0.4525
0.4645
0.4787
🔴SL:
0.3898
🧐The Alternate scenario:
If the price stabilizes below the trigger zone, the setup will be cancelled.

Alikze »» WIF | Ready to break supply areaIt has been moving in an upward channel at 12h and daily.
💎 Currently, after exiting this ascending channel, it has been suffering for some time in the range of the green box and the supply zone.
Considering the density in the trading range, I expect it to enter the ascending channel again after breaking the supply zone.
💎 If the supply zone is broken, it can touch the specified targets and the middle of the channel and then the next supply zone.
💎 Alternative scenario: If the green box area breaks, it can continue correction until 1.96.
»»»«««»»»«««»»»«««
Please support this idea with a LIKE and COMMENT if you find it useful and Click "Follow" on our profile if you'd like these trade ideas delivered straight to your email in the future.
Thanks for your continued support.
Sincerely.❤️
»»»«««»»»«««»»»«««

ARKArk is near to the weekly support
I preferer this coin because before it was trading by BTC only
📊 #ARK
🔼 LONG
💎 Entry: 0.53 - 0.56
💰 Target : 1.20
❌ Stoploss: 0.515
—————————
© Published by : TDAWLY

ARK LOOKS BEARISHIt looks like we have a bear structure for wave B.
A large B wave looks like an ABC or more complex pattern.
We now seem to be in wave b of B.
By maintaining the specified supply, it can move towards the targets.
Closing a daily candle above the invalidation level will violate the analysis
For risk management, please don't forget stop loss and capital management
When we reach the first target, save some profit and then change the stop to entry
Comment if you have any questions
Thank You

Alikze »» FLOKI | Negative divergence in 1HIn 1 hour time, it is moving in an ascending channel.
It is currently within the range of the channel ceiling and the supply area.
According to the divergence that exists, a correction to the middle of the channel and the bottom of the green box range can be done.
💎 If it breaks the supply range, this divergence will be invalid. So for now I expect it to have another correction inside the channel and after it is finished it can move as wide as the channel to the next supply range.
💎 Alternative scenario: if the green box is broken, the upward path of the currency will be a little difficult and may face further correction.
If the behavior and structure of the post changes, it will be updated.
»»»«««»»»«««»»»«««
Please support this idea with a LIKE and COMMENT if you find it useful and Click "Follow" on our profile if you'd like these trade ideas delivered straight to your email in the future.
Thanks for your continued support.
Sincerely.❤️
»»»«««»»»«««»»»«««

ROKU, PRICE TARGETS, TIME TO GO LONG?Maybe.
Chart has most of the info marked so there isn't much to say.
Sharp drop if the support trend breaks down.
Rejection trend is trading up.
Seems like it might be time to get some bigger movement on this stock.
Price can go up on a breakout pretty high, but also, careful above around 120.
Good luck!!

ARK/USDT it shows price will be test on demand and will bounce!💎 Paradisers, #ARK is showing promise as a potential coin to watch.
💎 It has encountered rejection at the resistance area, coinciding with the resistance of the descending channel. There's a possibility that the price will test the demand area around $0.767 to gather momentum before attempting another breakout of the resistance.
💎 A successful breakout here would signal a bullish continuation, but confirmation would require breaking through the CHoCH area to confirm a reversal in the bullish trend. If this scenario unfolds successfully, the price could reach our target area.
💎 However, if ARK fails to bounce at the demand area and breaks down, the next support level to watch is the major support area.
💎 This area has historically shown strength in sustaining ARK during downward movements, with consistent bounces upon reaching it, indicating significant buyer interest. If ARK successfully bounces from this level, it will need to break the $0.91 resistance to confirm further upward movement.
💎 Bullish invalidation would occur if ARK failed to hold the major support area and breaks down with a daily candle closing below it. Such a scenario could signal further downward movement in price.
MyCryptoParadise
iFeel the success🌴

ARK/USDT Ready to Capture the Liquidity Above? 👀🚀ARK Analysis💎Paradisers, prepare for a captivating shift in the #ARKUSDT market, suggesting a possible bullish surge from its current demand zone.
💎After a recent rejection from a strong supply zone, #Ark has cleared buy-side liquidity. This sets the stage for a possible downward move before rebounding from the critical bullish OB at $0.764. If LSE:ARK gathers enough bullish momentum, we might see a dynamic push challenging and potentially breaking through the upper supply zone.
💎However, if #ARK struggles to maintain ground within this crucial support zone, a quick strategic pivot might be needed. Here's where Plan B comes into play: we'd then focus on initiating a bullish move from a lower demand zone at $0.68. This level is crucial—if LSE:ARK drops below it, it could indicate early signs of a bearish trend in the market's narrative.
💎Stay sharp and be ready to adapt, Paradisers. Your ParadiseTeam is on watch, poised to guide you through the evolving dynamics of the #ARK market.

#ARK/USDT#ARK
The price is moving in a bearish channel on a 4-hour frame and is adhering to it well. The price has rebounded from the green zone and is expected to retest it at $0.650.
We have a tendency to stabilize above the Moving Average 100
We have a downtrend on the RSI indicator that was broken to support the rise
Entry price is 0.750
The first goal is 0.880
Second goal 1.00
Third goal 1.14
