ARK/BTC { ARK } - BULLISH SETUPANALYSIS.
- ARK/BTC is consolidating in a symmetrical triangle pattern.
- Price is testing the symmetricaltriangle's inclined support.
- The market could bounce from this support zone if we have a relatively large buyers concentration.
- Let's try this high R:R (4.76 : 180) trade on ARK/BTC pair.
- Note: there's a good possibility of hitting the stop loss, but it's worth the potential reward (× 36 of your risk).
BUY ENTRY ⬆️
- Current market price.
TARGETS 🎯
- 0.00005000.
- 0.00005910.
- 0.00007656.
STOP LOSS ❌
- 0.00002600.
ARKBTC
ARKBTC 1Wtest
ARK is a cryptocurrency- and blockchain- based development platform allowing anyone to create their own fully customizable and interoperable blockchain. Reducing the industries need for Smart Contracts by using custom transactions, logic and multiple programming languages.
ARK/BTC { ARK } - BULLISH SETUPANALYSIS 🔎
- ARK/BTC is printing the inversed head and shoulders pattern at its early stages.
- The inverse head and shoulders pattern is a bullish reversal pattern.
- Catching the pattern aggressively at its early stages would yield a good profit but it's quite risky.
BUY ENTRY ⬆️
- Current market price.
TARGETS 🎯
- Horizontal resistance level (@0.000040).
- Horizontal resistance level (@0.000050).
- Horizontal resistance level (@0.000064).
- Horizontal resistance level (@0.000094).
SETUP INVALIDATION ❌
- Initial invalidation: breakdown below the ascending trendline support.
- Final invalidation: beakdown below the right shoulder's horizontal suppor level (@0.00001943).
ARK/BTC { ARK } - BULLISH SETUPANALYSIS 🔎
- ARK/ BTC is testing the major ascending triangle's inclined support as expected from my previous analysis.
- Price action is printing a minor ascending triangle at the test zone.
- This is a bullish build up pattern.
- There's a breakout potential.
BUY ENTRY ⬆️
- Market entry: current market price.
- Stop limit entry: breakout above the minor ascending triangle's horizontal resistance (@0.00003100)
- Limit entry: test of the minor ascending triangle's inclined support.
TARGETS 🎯
- Major ascending triangle's horizontal resistance (@0.00003390)
- Further breakout above the major ascending triangle's horizontal resistance could lead to a pump to the fibonacci extension levels.
SETUP INVALIDATION ❌
- Breakdown below the minor and major ascending triangle's inclined support.
ARK Could Be a Sleeping Giant Breaking Out of a 4 Year WedgeKeep your eye on Ark. It has a beautiful weekly chart that appears to have broken out of a 4 year wedge. It's a low cap alt so entering early could be very lucrative as this price could really fly! Just relax, hodl, and let Ark do the rest. The height of the wedge is 42x its current price to give you an idea of the long-term potential.
ARKBTC Technical Analysis
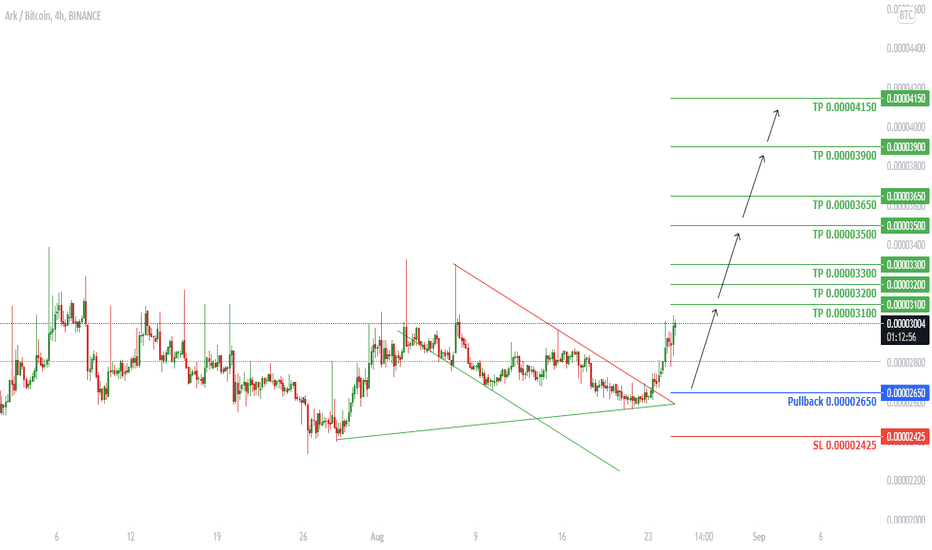
ARKBTC on H4 has broken above the Descending channel and triangle as well. It will go down for a pullback then it is expected to go higher.
⬆️Buy now or Buy at 0.00002651
⭕️SL @ 0.00002425
✅TP1 @ 0.00003100
✅TP2 @ 0.00003200
✅TP3 @ 0.00003300
✅TP4 @ 0.00003500
✅TP5 @ 0.00003650
✅TP6 @ 0.00003900
✅TP7 @ 0.00004150
Check the Links in Description and If you LIKE this analysis, Please support our page and Ideas by hitting the LIKE 👍 button. ❤️ Your Support is really appreciated! ❤️
Traders, if you have your own opinion about it, please write your own in the comment box. We will be glad for this.
Feel free to request any pair/instrument analysis or ask any questions in the comment section below.
We will have more FREE forecasts in TradingView soon
Have a Profitable Day
ARKBTC Before the end of NovemberARK BTC in monthly chart can break resistance and jumps to targets
use sl to exit and reenter 👍
ARK/BTC { ARK } - BULLISH SETUPANALYSIS 🔎
- ARK/BTC is printing an ascending triangle pattern.
- This is a bullish build up pattern.
- There's a breakout potential.
BUY ENTRY ⬆️
- Market entry: current market price.
- Stop limit entry: breakout above the ascending triangle's horizontal resistance (@0.0000339)
- Limit entry: test of the ascending triangle's inclined support.
TARGETS 🎯
- Fibonacci extension levels.
SETUP INVALIDATION ❌
- Breakdown below the ascending triangle's inclined support.
ARKBTC min target with estimated time . description
min target with estimated time
I look forward to a green week for altcoins.
And if true, it will continue for a long time.
We will all be surprised.
Ark/Usd long idea!If this stays in the triangle pattern it should take out these targets at breakout ! Long term upper targets go in excess of 1500%! Always use risk management when following anybody's charts!
ARK BTC inter #ARK #ARKBTC #BINANCE #altcoin #buy #trading #signal #crypto
ark is in uptrend and here can be good area to inter also the arrow can be sl to 3100
ARKBTA broke out resistance#ARKBTC has broken out from long term resistance and confirmed it as support. it's time to move upward
ark btc try last chance#ARK #binance #trade #altcoins #ARKBTC #crypto
ARKBTC 2900 was sl and now 2200 sat
ark btc so close to pump#ark #btc #arkbtc #binance #trade #crypto #arkcoin
What's are you waiting for?
ARK breakout, next TP targetsLet's see if ARK respects the fib levels on the come down.
Testing again the ceiling.
Breakout to the upside.
Targets on the upside are: between 8500 & 9000
take a look at the daily chart ARK BTC take a look at the daily chart after looking chart in weekly and mounthly then trade in dayli not befor !


