Short $ARKK CMP $93.86Short $ARKK CMP $93.86. $ARKK failed to maintain the momentum. Volume is drying. Did not make higher high. Expect it to fall to $85 area or further down. Holding near very important level of support.
ARKK

ARKK - Hydrophones Picking Up NoiseWood's Hole has been busy with the creaking sounds from the Deep Blue.
Small Caps within the Covenant have been leaking badly, some now down 70&.
Full bubble engaged.
_____________________________________________________________________
Innovation Spec, Meta, and Cathy all wondering why, of course, it will be another
dip buy for Future Value.
We disagree with her Thesis and believe recalibration of her Grift is needed.
A carnie is a carnie.
The Big Top fire is spreading, Noah is loading the critters, while the mid 60s
appear to be too much of an angle for the ARKK sub to withstand.
______________________________________________________________________
100% CASH on Close.

Capitulated on ARKKI put my faith in Cathie and engaged in the Twitter spat between her and Puru. That ego cost me. My stops below the price action range have triggered and if the Weekly bar closes where it is now AMEX:ARKK will be in a confirmed bearish trend. I'm not going to baghold and hope. I've closed out my shares of ARKK but left on the June Calls which I'll let come back or expire.

$XLE $SXLE 2022 Setup Perfect formation and setup for Energy stocks which I expect bullish performance till end of Q2 2022 and by then most likely 2 interest hikes will be already done. Then as of Q3 also due to base effect inflation will start to come down and rotaion will be from value to growth stocks.
on Weekly chart it is even more visible. My 2022 portfolio will be on precious metals gold and silver (more on silver) and energy stocks till June-July and then switching to beaten down tech stocks like ARKK, ARKG, SE, LSPD NOW etc.

$ARKK Analysis 30m scale$ARKK on the smaller time frames is providing some great trading opportunities. The volatility is there and we are starting off a new year. I am looking for a long opportunity around the $93-$94 range.
Support: $94.00, $93.00
Resistance: $96.50, $100.00

$ARKK AnalysisAfter a 37 point sell of in $ARKK from a recent pivot high ($125.86), we are starting to see some growth names base and reverse. While the overall trend on $ARKK is still down, the smaller time frames are showing signs of strength and reversal structure. ARKK

HOOD $75 PT - Cognitive DissonanceThoughts below, future chart candles are just for fun -
Cognitive dissonance driven by retail and news media's love affair together around hating the stock. If you set aside personal bias, they have a history of finding creative ways to add new users which get emulated by the competition (IBKR just got around to adding Instant Deposit). They're the most competitively positioned broker for future growth and they have the means to get there without raising additional capital anytime soon, as of the end of their most recent quarter Q3 they had 6 billion in cash and cash equivalents on their balance sheet.
Banning Payment for Order Flow is unrealistic, the way things are leaning the SEC will require more transparent and timely public reporting of short selling data to regain public trust. Quicker settlement like T+1 has some traction as well, any improvement here is good for the HOOD.
Large fund flows into the stock (D1 Capital, ARK) and short seller profit taking (Deutche Bank) appear to be underway, the next 13F filings will help confirm sentiment change.
2022 will see significant product functionality releases as HOOD grows out of its simple trading app for millennials image and gets accepted as a "real" broker with competitive tools.
Fully embracing the crypto space, recent acqui-hire brings top talent to their crypto development team and suggests something big is cooking but they're holding their cards close. Most recent 10Q is vague around the product roadmap and mentions items which clearly diverge from the actions they're actually taking. You can barely consider them a crypto trading platform currently since they only have a few assets available and price execution is lousy. However, Robinhood has an opportunity to eat Coinbase's lunch, unless they squander it entirely.
Just technical, reversion to Mean. It's no secret there's a significant divergence between individual stock performance and the mega-caps/indexes.

Rolling: ARKK January 21st 95.22C/104.22P to February 18th... 94.22C/104.22P inverted short strangle for a 3.80 credit.
Comments: Rolling this a smidge early here. Total credits collected of 15.25 as of the last adjustment (See Post Below) plus the credit received for this roll. The setup is inverted by 10.00, so I can still make money on it because I've collected more in credits than the inversion, but am more likely just to scratch it out if I get the opportunity so that I can reload an unbroken setup. I would note that there was a dividend/special distribution on the 29th which affected the strike prices of the setup.

Trading plan on BYND for 2022. This is what I want to see. The main level I'm interested in is the support at 50.00. If the price reaches that level, I will start thinking about bullish opportunities.
Let's assume that happens. The pattern I want to see is:
First: breakout of the current descending trendline
Second: a corrective movement with similar proportions to the red line you can see on the chart
IF all that happens, I will develop setups towards the next relevant level at 160.00. The horizontal yellow line you can see on the chart is a price level I will use to move my stop loss to break even because it may work as a reversal zone. This setup may become available between 30 to 60 days. In the meantime, it's important to have patience and avoid getting involved with low-quality scenarios.
Thanks for reading, and feel free to share your view on the comments ;)

The good days hve been past long time ago..!9 months ago, I published this analysis:
the first target could be 97..!
however, This time it could go down more?
You can see the most important support (green lines) and resistance (red lines) to watch in the coming days in these charts!
Best,
Moshkelgosha
DISCLAIMER
I’m not a certified financial planner/advisor, a certified financial analyst, an economist, a CPA, an accountant, or a lawyer. I’m not a finance professional through formal education. The contents on this site are for informational purposes only and do not constitute financial, accounting, or legal advice. I can’t promise that the information shared on my posts is appropriate for you or anyone else. By using this site, you agree to hold me harmless from any ramifications, financial or otherwise, that occur to you as a result of acting on information found on this site.

ARKK Entering Bearish BAMM (50% Potential Downside) ARKK has broken through he B point of this potential Bullish Bat and has tested it as Resistance we look to be ready to complete the CD wave to the downside and reach an 88.6% Retracement.
I suggest some Near or ITM PUTs expiring around several weeks from now.

All the relevant levels on COIN and trading opportunities. Today, we will take a look at COIN
Which are the main elements we can see?
1) The price has already reached the major support zone (or bearish target) and has bounced there.
2) So, what would be a good scenario to think about in terms of bullish opportunities?
3) I would like to see the breakout of the current bearish trend (yellow line) and then a corrective pattern with similar proportions to the red line you see on the chart.
4) IF that happens, then I think that's a great scenario to develop setups around that correction. IF that doesn't happen, you don't do anything.
5) The target I have for the bullish movement in case all the previous filters are fulfilled is 360
6) There is a level where we should pay attention to 294.00 (there we can see small reactions or reversal movements)
At the moment, we have defined the plan, and we need to see how the price proceeds to create a more accurate scenario. Thanks for reading, and feel free to share your view in the comments.

ARKK Uptrend, $110 retest by EOY, all time highs next year.ARKK has gotten destroyed this year, but it's showed signs of bottoming after three green weeks. I think growth stocks have done enough correcting. SPY is at all time highs, but big names are still 40%+ off their highs in ARKK. I think after omicron becomes endemic (this is going to happen in 2-3 weeks), everything starts to go risk on again. ARKK and crypto are the beneficiaries of this risk on environment.

ARKK - The Confederacy of the DunceApologies Milli's / Gen Z Cultists.
Ignorance is an excuse until your Sorceress's "Thesis" is proven wrong.
____________________________________________________________
Where to begin... this has been ongoing for Month Six now.
Wood's is a complete Fraud, a Carnie of the MetaVerse, a complete
Predatory Package for the youth of our Nation.
Every Generation has its Hero for Tech, Wood's was hailed for her
Strategy.
_____________________________________________________________
Permit me to Wreck the Illusion...
Cathy claims to have 5 Year Time Horizons for "Investment" - a Longer Term
Buy and Hold, chanting to the Universe and making discoveries on Saturdays.
Woods has churned her Fund more than any other Fund - Trading in and out
of TESLA at extremes which are laughable. Buying High / Selling Low is her
stock in Trade. Please read the filings and see for yourself.
This Degenerate Fund Churner manages to buy the most Ill-liquid and thinly
Traded Equities becoming the Egg Woman. She has lost hundreds of Millions
using this idiocy when forced to SELL, and she does.
ZILLOW was a very large holding.
Cathy SOLD into the LOWS after hemorrhaging Capital - the Fund Average was
claimed to be $67.57 is incorrect. The ARKK Fund Average was - spread among
more than a FEW of Cathy's Funds from 67.57 to 73.91 to by far the largest
holding within ARKK @ $82.51.
The total loss is well North of $40 MIllion.
Recorded SELLS:
November 17, 2021 @ 31,361
November 15, 2021 @ 471,622
November 12, 2021 @ 589,903
November 11, 2021 @ 137,710
November 5, 2021 @ 1,610,884
This has happened dozen of times as the Fund grew from $10 Billion to $85 Billion
die to Inflows from her largest Cult Base - REDDIT.
It will lose 63% of its "Value" - at minimum.
Cathy is a turn, burn and churn Artist.
____________________________________________________________________
We warned repeatedly this was a complete Scam, another False Prophet for the Ages.
Her "Most Unexpected" excuses continue to mount.
Buying High, Concentration Risk, Liquidity Risk - remains her Risk.
Price tells you everything you need to know, we heavily warned to exit this Junk Fund
with JUNK Leadership... See Price.
It's far from over for ARKK.
In Five years this Fund will not exist IMHO.

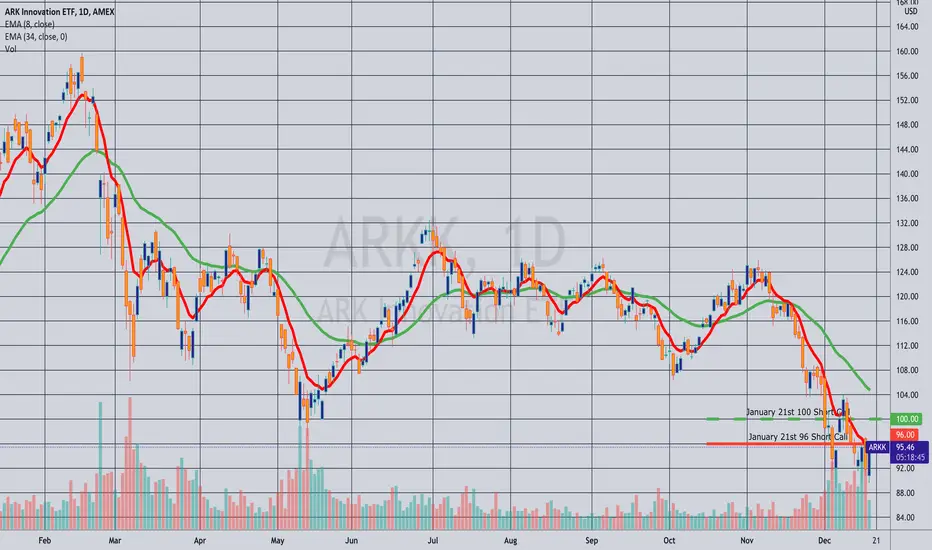
Rolling: ARKK January 21st 100 Short Call to 96... for a 1.23 credit.
Comments: The last of my Friday defensive adjustments/cost basis reduction rolls. Here, rolling down the short call aspect of my inverted short strangle, the short put end of which is at the 105 strike. Total credits collected of 11.45 (See Posts Below), so my downside break even is 105 (the short put strike) minus 11.45 or 93.55.
Is the carnage over for $ARKK?I'm a big fan of what Cathy and her team are doing research wise. I caught the uptrend last fall and made money. Unfortunately the Wall Street Fashion Show has moved on from the ARK line of stocks. I do have my criticisms of ARK: They have too many funds, trade too much and catch too many falling knives. These practices are amplifying the downside move IMO. The threat of rising rates, the falling out of favor with the fashion show, and the relentless rotation out of disruptive tech into physical economy stocks shows no sign of reversing anytime soon. POSITION: LONG $SARK - the inverse ARKK ETF.

Trading template for LYB | Full explanationToday, we will take a look at LYB . We can see the price has been moving inside a correction for the last 195 days, and the structure is clear enough to understand its more external limits.
The way I thought this scenario was like this. How many times in the past were similar situations like the current one, and the next question is can I observe a pattern so I can trade?
The answer is: This has happened several times in the past, and yes, there is a clear pattern that I can wait for. Let me show you:
The explanation here is: First we need a big structure (which we already have), then we want to see a breakout followed by a 15 days correction) IF that happens, we want to see the first breakout of that followed by a candlestick below that breakout movement, and at that moment, we set bullish pending orders on the new local high with the stop loss on the previous low. The expected risk to reward ratio on this is 2.5, and based on the previous examples, we had 2 profits and 1 break-even.
What happens if the filter is never fulfilled?: We don't trade ;)
What happens if the filter is fulfilled, your setup is executed, and then the price goes directly to the stop loss:? I lose 3% of my trading capital, and I keep executing as emotionless as possible :D
It's important to show that by doing this, I can eliminate all the emotions from this execution, and by doing that, I can follow my plan without changing things on my strategy. One of the main reasons people are not able to achieve consistency is not because they don't have a good system but because they are not able to follow it (trading psychology)
Thanks for reading! Feel free to share your view and thoughts in the comments.


Cathie Wood needs trading intelligenceLove Cathie Wood's mental model for finding future opportunities, but, her lack of trading intelligence is her weakness. A simple algo with moving avgs and a few other simple addons would change so much.
Green Arrows = ATTACK ATTACK ATTACK
RED Arrows = PATIENCE PATIENCE PATIENCE

CRSP on a major weekly level. What's coming next? Today we will take a look at CRISPR Therapeutics.
Which are the main technical elements we can see here?
a) The price is against a major Support/Resistance level, working since 2018. The price reaction on these zones tends to provide solid insight into future movements.
b) Let's assume the price bounces on the current zone; what can we expect?
- A movement towards the descending trendline around 100.00. IF that happens, that would be a take-profit level for me. Why? Because we tend to observe corrections once the price reaches a major level. You don't want to be insight a sideways movement for 100 days
c) Let's assume that the price breaks the current level and keeps falling. What can we expect?
- A movement towards the ascending trendline around 50.00. That would be the next level where I would start thinking again about bullish reversals.
d) I'm a position trader. What is the most relevant level right now to develop setups?
-If that's your case, I want to see first a breakout of the descending trendline; IF that happens, I want to see a correction of around 50 days. IF that is the case, I will be interested in trading that breakout for the long term. However, at the moment, we are far away from that situation, and I would stay away from this chart for long-term setups.
Thanks for reading! Feel free to share your view of this in the comments.

Ark Innovation ETF Analysis 10.12.2021Hello Traders,
welcome to this free and educational analysis.
I am going to explain where I think this asset is going to go over the next few days and weeks and where I would look for trading opportunities.
If you have any questions or suggestions which asset I should analyse tomorrow, please leave a comment below.
If you enjoyed this analysis, I would definitely appreciate it, if you smash that like button and maybe consider following my channel.
Thank you for watching and I will see you tomorrow!

Money where your mouth is... ARKKI admire folks that are willing to put their trading out there for comment and criticism. It takes a lot of emotional control to trade in isolation much less when under public scrutiny. Cathie Wood was the idol of the trading world last year and widely followed for her style of exciting and parabolic investing as well as her public charisma and confidence.
There was one interview in particular (I wish I could find it now but she has done many) where she acknowledged that within her trading history she has had cycles of incredible returns invariably followed by large drawdowns. She gave this interview right around the peak of her funds' performance last year. Real recognize real. That she would openly acknowledge and admit that she had self identified this pattern of her trading spoke to my own journey and likely that of all serious traders. She had acute self awareness and in some way, in that interview and comment, was warning people to be cautious with her strategy at that current moment.
Now as her funds decline other traders are trying to make a name for themselves off her fall. One of which that has come to my attention is Puru Saxena. He is vocally short her funds and very bearish. That is fine for them to have a battle; no need for me to get involved. Cathie has her strategy focused on long term growth. Puru bases his strategy on macro. Neither are my game.
But now it gets interesting for me as a Technical Trader.
At the same time Puru is adding to his short AMEX:ARKK is sitting right at a 50% Retracement of the major trend. Over the last few days price spiked below this level only to recover quickly above it. These are my strategy.
So now I get to step into this battle by putting my own capital on the line. It's a low risk/high reward trade. Not for the money but for the validation of Technical Analysis versus macro.

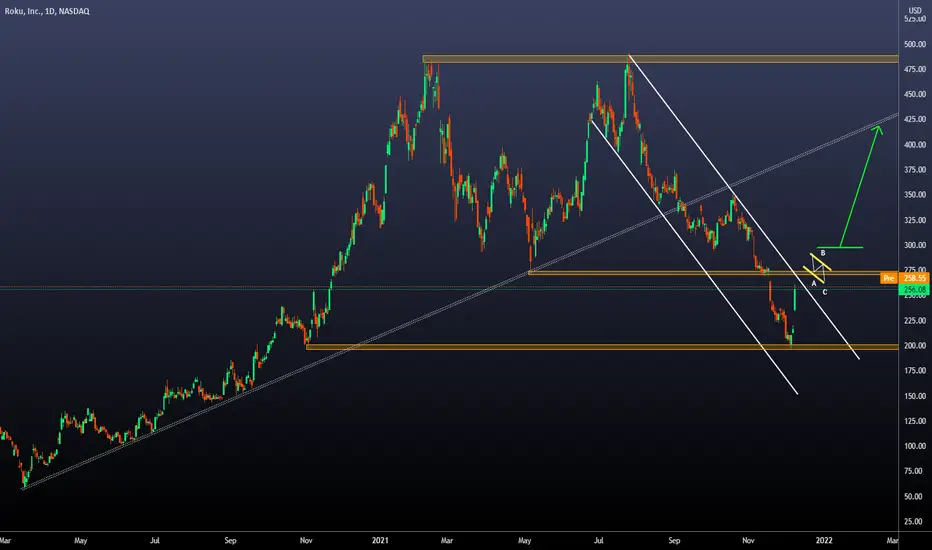
Trade Idea on ROKU | What I want to see before tradingToday we will take a look at ROKU.
What can we see from a technical perspective?
a) Currently, ROKU is on a Drawdown of 60% from the previous ATH on JUL 2021. And if we take the first top on February 2021, we have been on a drawdown period of 290 days +
b) The main bearish structure we have right now is the descending channel. While the price stays inside that structure, I will keep thinking that the price is on a solid bearish trend. However, based on past behavior, I think we may see a breakout soon.
c) OK, what do I want to see before trading if the breakout happens? So, the first filter is the breakout, and after that, I want to see a 5 to 10 days structure with the proportion you can see on the chart (yellow ABC flat pattern).
d) IF all the previous filters happen, I will open positions on the green horizontal line (new local high), stop loss below the correction, and target the last broken ascending trendline.
e) The risk I will be taking on a setup like this is between 2% to 3% of my trading capital. The expected duration of the setup (if everything goes as expected) is between 30 to 60 days.
f) It's important to say that if the filter doesn't happen then, you don't trade :D that simple. And if the filter happens and the trade is executed, the odds of being right is around 50%. However, the risk to reward ratio we will be looking for here is around 2.5
Feel free to share your view of the current situation in the comments! Thanks.