ARKK 1D - Golden Cross Coming UpARK Innovation ETF (ARKK) led by Cathie Wood is shown a possible near break of the triangle with a possible golden cross on the MA coming up very soon. I plotted fib levels to see how I we can possibly go. There has been consolidation since March 2021. It seems that a breakout is coming very soon.
What are your opinions on this? Comment below, hit the like and follow me. Thank you!
Check out more below for recent Altcoin, Bitcoin and Stock Ideas.
Disclosure: This is just my opinion and not any type of financial advice. I enjoy charting and discussing technical analysis . Don't trade based on my advice. Do your own research! #cryptopickk #bitcoin #altcoins
ARKK

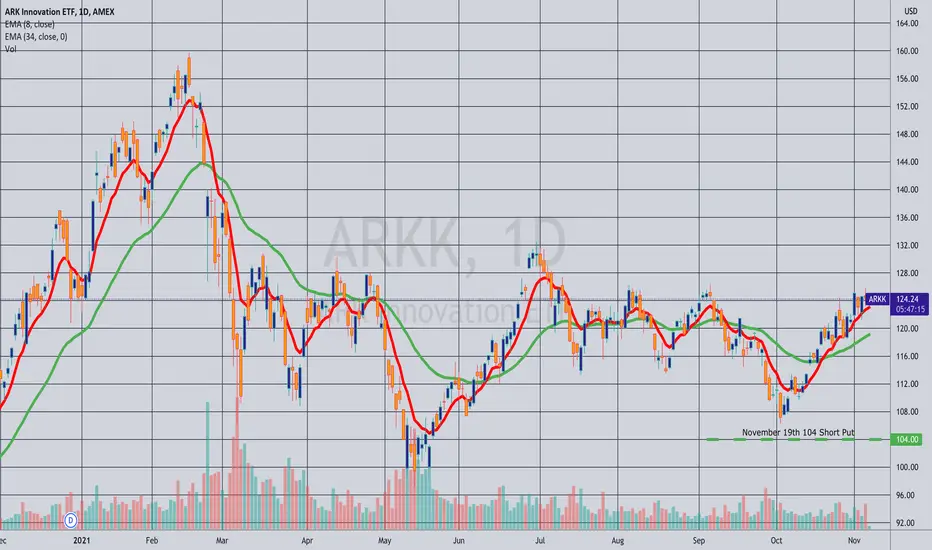
Closing (IRA): ARKK November 19th 104 Short Puts... for a .22/contract debit.
Comments: Collected a total of 5.02 in credits (See Post Below); out here for .22. 4.80 ($480) profit/contract.
Trading plan on BYND | A key name in the Plant-based industryToday we will talk about Beyond meat!
There is a curious thing about this chart , and that's the dynamic support it has been working on since Jun 2020. We have been observing several contacts since that date, and it tends to respect it pretty well.
Alright, nice line, but what then? Okay, the idea here is either the price has already made contact with it or is close to making it. AND it may be a relevant situation to start thinking about bullish setups.
As you may know, the way we trade is about looking for similar situations to the current one and creating a model on WHAT we want to see before risking one single dollar. Here are our conclusions:
-The price is making contact with a relevant dynamic support level
-The price is inside a descending structure
-IF we have a clear breakout of this structure, we want to observe a corrective pattern with similar proportions as the ABC draft we made on the chart. This is a similar sequence that has been happening since 2020
Do you want to know whats the best thing about trading this way? If the price does not make the filter we are expecting; I don't give a..... because I don't trade it, and I will be paying attention to other charts that have moved accordingly to the expected filters.
Under this method, the only guarantee you have is that when the price makes what you are expecting, you know you are in front of a high-quality situation. The bad thing about this method is that a lot of ideas will not happen as expected; that's why patience is extremely important. But if you learn how to become patient is an excellent way of trading, and a massive edge against investors that lack patience.
Thanks for reading! Feel free to share your view and ideas about the post of the chart in the comments box.

ARKQ (Weekly) has potential upsideAMEX:ARKQ has potential to break out to the upside if it manages to close above 85.80. Possible target areas 101.10 and 108.30.
Will likely take some time as this is based off its weekly chart.

Opening: ARKK December 17th 106/135 Short Strangle... for a 3.04 credit.
Comments: Venturing back out into margin account trading land with this delta neutral short strangle in the December monthly camped out at the 18 delta strikes. This results in 2x expected move break evens at 102.96 and 138.05.
3.04 credit on buying power effect of 12.11; 25.1% ROC at max as a function of buying power effect; 12.6% ROC at 50% max. Will look to take profit at 50% max and/or manage sides on approaching worthless or side test.

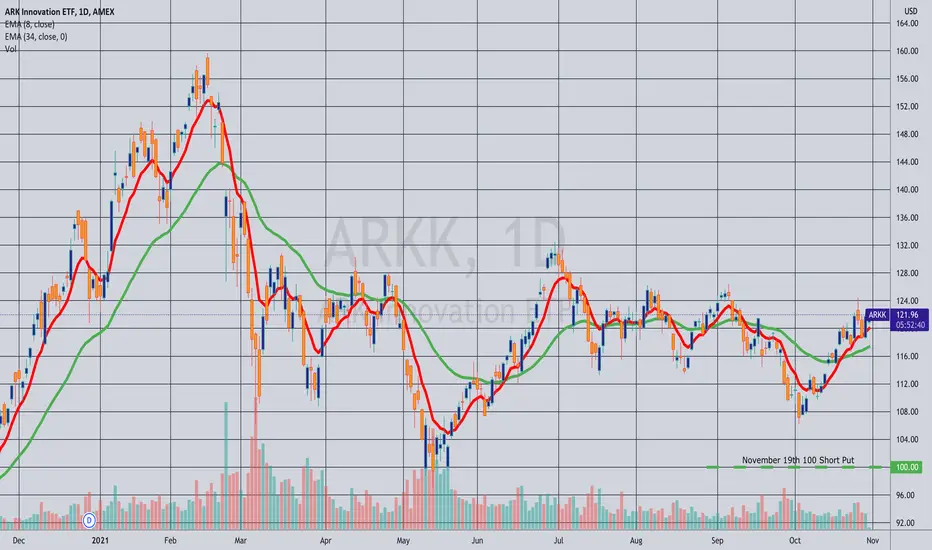
Closing (IRA): ARKK November 19th 100 Short Put... for a .26 debit.
Comments: In for 2.09 (See Post Below), out for .26 here, 1.83 ($183) profit.
$HOOD TRADING BELOW IPO PRICESRobinhood Plunges After Huge Revenue Miss, Terrible Guidance, 7.51 % After Hours.
$HOOD exec says the company will seek regulatory clarity before bringing any new cryptocurrencies to the platform
$HOOD Revenue Per User: -36% y/y
$HOOD CFO: "It's going to be impossible for us to accurately predict revenue on a quarter-to-quarter basis."
$HOOD Crypto Trading Revenue: -78% q/q
Good Lecture on $HOOD and why it's a bubble 💭
quoththeraven.substack.com

Can we expect a new bullish impulse on SQ? Today we will take a look at Square Inc. Jack Dorsey's company. In case you don't know who Jack Dorsey is, he is the founder of Twitter inc. In case you don't know what Twitter is... (I'm just joking)
Let's go back to Technical Analysis:
I can see two clear structures here:
*The previous impulse (which is a sequence of higher highs and higher lows) + The current major correction is a sequence of movements inside a constrained range. Ok, what is so special about that? Using Elliott Wave Theory, we can see the relationships between these two movements; one is a correction of the other one. And what Elliott concluded is that the next bullish impulse (IF it comes) will have kind of a relationship in terms of proportions with the previous impulse. That's why we use Fibonacci Extensions to define targets. Key Take away of this bullet point: The targets for a possible bullish movement are: 350 / 400 / 440
* Now let's take a look into the current major correction: After 170 days below the previous high, we saw the breakout in August, after that the price has been correcting on edge (which is pretty standard, after the breakout of structures of this size) This minor correction has been on its range for almost 80 days.
* Conclusions: IF (capital letters, conditional sentence) the price makes a new ATH, we will consider that as an activation level for the bullish view. Targets are the levels we mentioned before. Invalidation level will be below the minor correction at 218.00/ IF not the analysis is not valid (that simple)
*The expected duration for a movement like this can go between 100 to 150 days
Thanks for reading guys! Remember to add any ideas or thoughts to the comment. Protect your capital!!!

Massive bullflag on ARKK?Massive bull flag on the ARK Innovation ETF? I'm increasing my holdings here

ARKK - MA200 resistanceTo me the only question is whether we break 123$ which is the upper bound and also coincides with MA200 line. Only once we pass MA200, I can have the confidence of bullish trend back on.

Can ARKK Break out of resistance level 1?ARKK has been taking a beating in 2021 after a superior outperformance in 2020. Tracking this triangulation pattern before the ETF makes another move higher targeting the 157 upside

$ROKU NEXT STOP THE MOON! 🚀🌕 - Swing Trade
- Price Action bouncing from support (GreenBox)
- Greenbox serving as support since late January.
- The last daily candle looks bullish and pinned.
- Earnings on 10 Nov 2021
PT Inside RedBox.

TDOC First Target $146TDOC broke and retested downward trend line and horizontal support. It has 20 and 50 ema dynamic supports underneath (4 hour). Target would be $146 resistance which is in line with the 200 ma on the 4 hour. - HH

$ARKK - Has broken trend lineAfter some consolidation and selling pressure, ARKK has broken to the upside and has broken through a trend line. I would wait for a re-test of this trend line and then go long $ARKK.

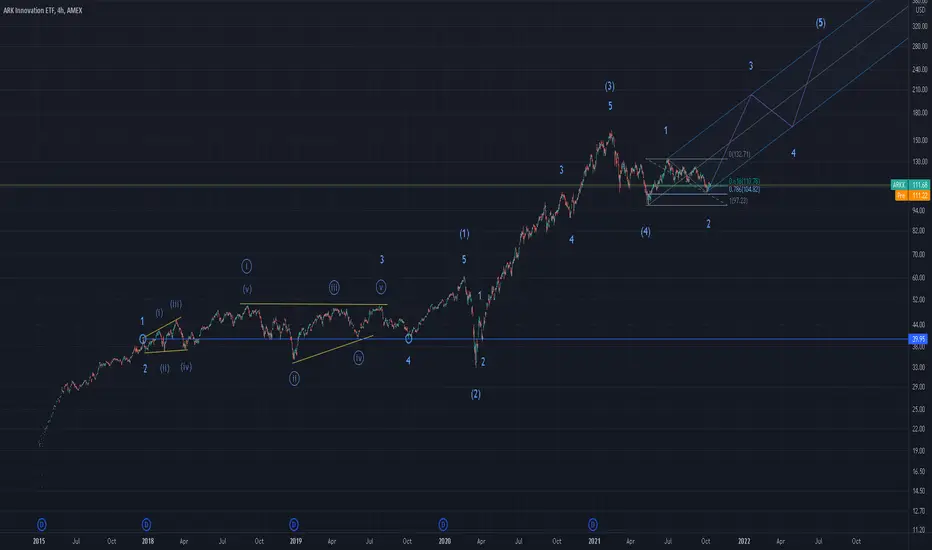
ARKK bullish - wave 3 of (5) startedWe have entered the final wave (5) of the impulse from the start of the EFT
Expected target 200-250 mid 2022. By then expect a significant drop
TrendyCharts: ARKK Inverse H&SThe bigger picture shows a wedge with price at the bottom range. We've got two confluence patterns here
Inverse Head and Shoulders
Break of trendline
PT right before supply.

ARK Innovation ETF (ARKK) • Signs of weakness still in placeARKK currently in a no-man's land. But there are some signs of weakness showing up.
It looks like it is better to stay out of ARKK for now.
Next major supports around 95 and 70. Confluence between monthly opens and 50% retrace levels.

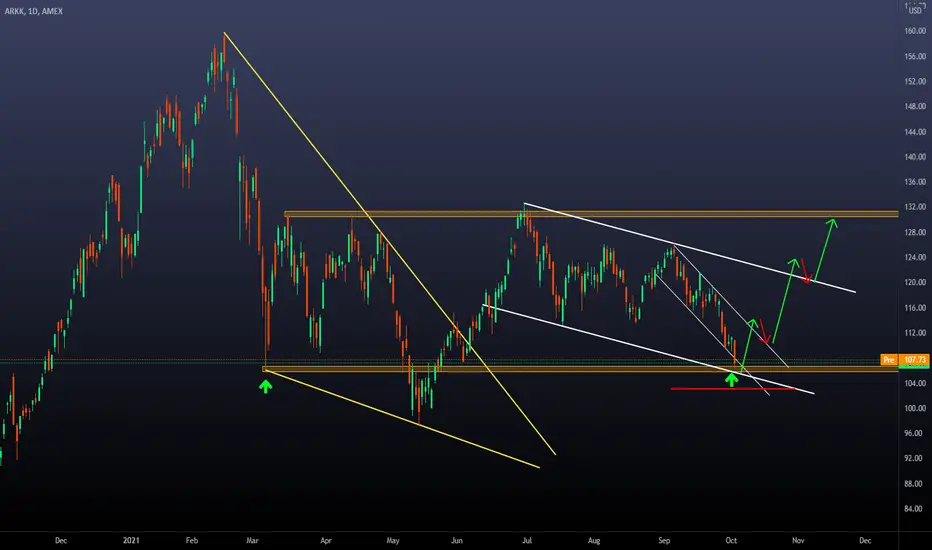
Are we on a relevant bouncing level on ARKK? Today we will take a look at Cathie Wood´s flagship, ARKK.
Main elements of the chart:
a) The price is against a resistance level + Lower trendline of the flag pattern (bigger white structure) + Lower trendline of the inner descending channel.
b) Generally speaking, every time we find this level of alignment between technical elements, we tend to observe good reactions.
c) So, should we BUY? No, remember that you should always use confirmations or filters before taking action. In this case, we want to see a bounce + small correction on the edge of the inner descending channel. If that happens, we can think about trading towards the higher trendline of the flag pattern (bigger white structure)
d) What are the targets I can expect? We have two to propose. The first one is the higher trendline of the Flag pattern, and the second target is the resistance level at 130.00
e) Speaking about duration, we can expect a 50 to 70 days movement for a full movement like the one we are expecting
f) We also have defined a red horizontal line that represents an invalidation level for this analysis. That means that we will assume that the price broke the current level, and we should expect bearish pressure until the next support level.
Thanks for reading!
-32% in the past 32 weeks!The weekly chart of ARKK could show you a very beautiful picture of what you are going to experience in the next 25-74 weeks..!
As you see, ARKK could stagnate for a long time before any breakout! the last 2 stagnation period were as long as59-106 weeks!
In the past 32 weeks, it has lost 32%, and its price volume decreased more than 70% from 13.4 billion a week to 4 billion!
Crossing below the 50 EMA in the weekly chart should be considered a very important negative factor!
Any asset could be a buy or sell opportunity at any given moment, and we should look at the opportunities, not the asset's name!
Moshkelgosha

Tesla and ARKK correlation!While Tesla and ARKK have had a significant positive correlation in the past 5 years, they have lost it 20 days ago!
This is very unusual for ARKK to be negative when tesla is positive..!
It could be because ARK selling its stakes in Tesla:
According to Ark's daily transaction reports, three of the firm's funds, including its flagship Ark Innovation ETF, sold a combined 142,708 shares of Tesla on Wednesday, representing a stake worth about $108 million and adding to separate sales of about $166 million since late July.
The newest transactions come just days after Wood touted Tesla's success and gave shares a price target of $3,000 (nearly 300% more than current levels) in an interview with Yahoo! Finance, saying the company's growing market share makes it poised to benefit from a nearly 18-fold increase in electric-vehicle sales by 2025.
It seems she does not believe in her own analysis!
www.forbes.com

$ARKK Looking for $100I'm aiming for $98 based on supply/demand zones. As long as it can clear the noted gap on the volume shelf, I think $98 will follow shortly after.

ARK invest and no plan for 2021..!This is a comparison between the so-called ARK invest flagship AMEX:ARKK and SP:SPX , TVC:NDX , TVC:DJI , and TVC:RUT .
While all major indexes show a positive return in 2021, ARKK is -10% negative in 2021..!
Let's look at her past performance in case a crisis happens in the market!
2008: Cathie Wood
UNDERPERFORMS Category, UNDERPERFORMS T Rowe
ABSRP: -45.12% (before fees)
CHCIX: -48.28%
PRNHX: -38.78%
Growth Category: -43.77%
These numbers speak..!
Best
Moshkelgosha

High-Quality levels on DraftKings.Today we will take the last year of price quotation and we will work on all the relevant levels we will e paying attention
a) The main aspect we can see are the exteriors support and resistance levels (these are our framework)
b) Inside our range, we can draw a trendline that may work as a relevant support level. From there, we can expect a bounce and the following correction (Trading Opportunity 1). As we are breakout traders, these corrections are what we are looking for before entering the market
c) If the price breaks the previously mentioned level, we will aim to see the price on the next support level (lower zone of our range) at 35USD. From there, we will expect the same sequence: bounce + the following correction.
d) Both trading opportunities will share the same target 64USD, however, it is important to mention the inner resistance level at 56.00 USD (there we should be open to possible corrections)
e) Final Idea: Remember, the best way of developing high-quality setups is by waiting for the price to reach high-quality zones. Working setups from there increase your odds of success
Thanks for reading!
