Time To Buy Coinbase? [LONG]With all the excitement around Robinhood's IPO this week and the recent resurgence of Bitcoin its easy to forget about COIN, after what appears to be the completion of a 51% retracement in price according to the Fibonacci retracement we see here.
Since this retracement, COIN has quietly sprung 30% in price and appears to only be getting started if the chart I have illustrated here holds true.
COIN has broken shallow retracement areas of its pull back and now appears to be gearing up for what could be an 8% move to its first target at around $292 per share.
It is currently at a perfect low risk high reward trade currently as your likely risk to start off (if entering a long right this minute) would be -3%. However, your reward would be 8% and that would only be getting the party started.
Anything below $259.92 is bearish and we want nothing to do with this asset at that point as this would be a breaking of the .236 fib level. It should be noted that a daily candle close below this level is what we would be looking for to confirm the bearish scenario.
In the meantime this looks like a possible fun trade as the crypto market appears to be buzzing again and who none other than Coinbase should stand to benefit mightily.
ARKK

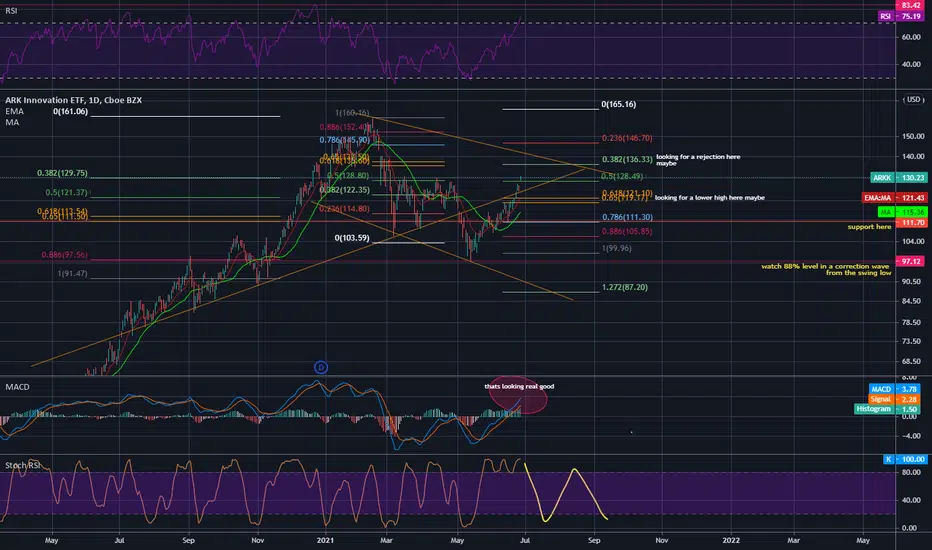
$ARKK Watch $ARKK to breakout above the slopeIf market cooperates, watch $ARKK to break above this trendline. Not a bad idea to take a very small position here and add on breakout

Closing (IRA): ARKK August 20th 110 Short Put... for a .38/contract debit.
Comments: In for 1.95/contract (See Post Below); out for .38 here. 1.57 ($157) profit/contract. Still have the September 102's on.

Long | ARKK | Swing TradeAMEX:ARKK
Possible Scenario: LONG
Evidence: Price Action, Symmetrical Continuation Triangle, it's ready for break out
TP1: 130$
TP1: 140$
Call options with delta 0.25 for end of the year are great.
*This is my idea and could be wrong 100%.

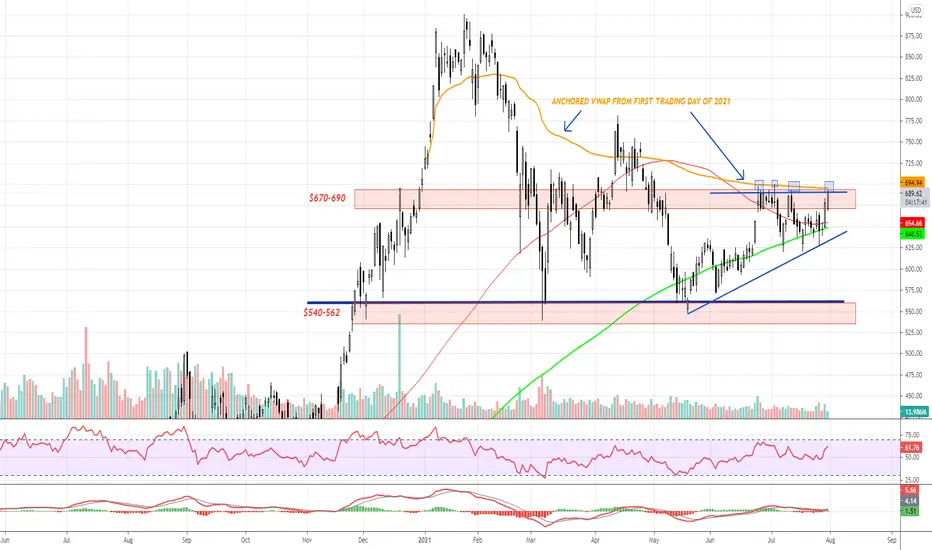
$TESLA Observation - Anchored VWAP resistanceThe anchored Vwap since the start of the year has been providing meaningful resistance for the price action of Tesla ever since the market started trading under it. This will be an important level to watch as it will shift the balance in favor of the bulls should price manage to trade above it. However, as long as we stay below this important level.. The majority of participants who have purchased a position in Tesla this year are under water and will be under pressure to sell if we are not able to make a meaningful move over the Anchored Vwap level (orange line - 694.94 currently). Price is stuck within the 200 day moving average (green line) providing support and the anchored vwap as resistance, so we will need to watch for a convincing break of either to decipher where the next big move is coming from..
ARKK of a DiverOverexposure to TSLA as well as Small Cap exposure will see ARKK shed 50% from its Highs.
Minimum.
We sold 122.88 and see 103 as our initial Target.

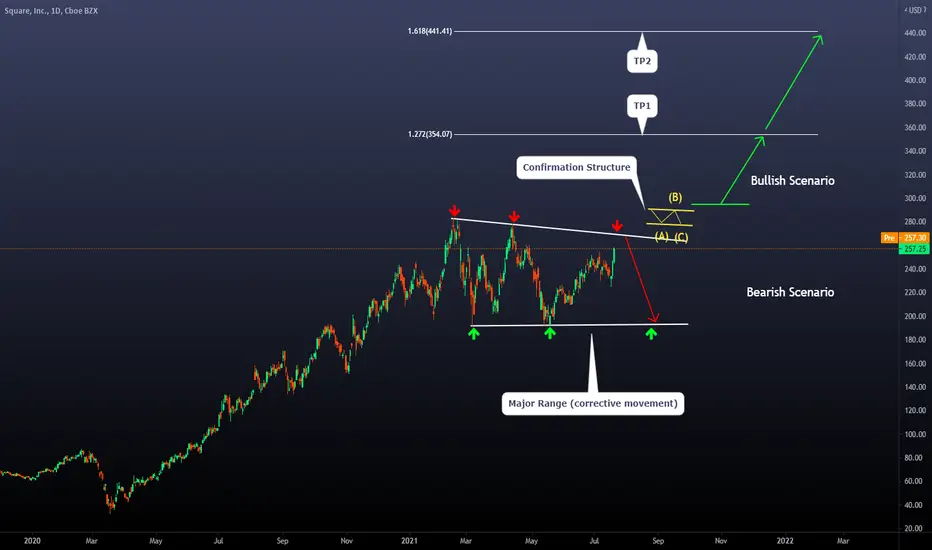
Two scenarios explained on Square INCToday we will analyze SQ. This company is the 4th biggest Holding of ARKK and is run by Jack Dorsey (Twitter funder)
So what can we see here?
1) The main structure: We have a horizontal compressive channel that has been in formation since its peak on FEBRUARY 2021. This is useful because we can know if the price has made a clear breakout or not based on the reaction on these levels and daily candlesticks closing above or below. The main idea here is: If the price stays inside these levels, don't assume any breakout yet.
2) Possible Bearish Scenario: If the price reaches the highest level of the structure and reacts there, we can expect a bearish movement towards the other side of the range. (Interesting level for reversal traders)
3) Possible Bullish Scenario: When we want to develop swing setups based on new trends starting, we take some considerations before risking our money. First of all (Clear Breakout), we want to observe a new ATH (no doubt that the price broke the structure). After that, we want to observe a small consolidation, as you can see with the yellow lines. IF that happens, we can trade above that and set stop loss below the level. This provides a great confirmation and a setup with a perfect Risk-Reward Ratio of almost 1:3 to the first target. Expected time towards the final target (150 - 200 days if the scenario goes as expected)
As you can see, we don't care at all about the direction of the market. Taking rigid views with any asset is not a good idea because it doesn't allow you to adapt to changing conditions. That's the reason we work with "Scenarios." Based on this, the only situation we are interested in is the bullish one (Swing Setup); otherwise, we will stay on the sidelines.
Thanks for reading! Feel free to show your view in the comments.
Teladoc Trade [TDOC]A staple of Cathie Wood's ARKK Invest fund, Teladoc looks to be winding up for a big move in the coming days after breaking the resistance of a supply line that has kept TDOC stagnant since the peak of its small rally in June.
Now we find it at a key support level just outside of the trendline and finding support on our 21 MA as well.
I am long on TDOC with a stop loss at $149.99. At this point, if the green horizontal line of support would be broken, the next level we want to look at for a long would be $146.84. However, a break and close of $146 would be a break into my no trade zone.
Bonus points for the asset if it can hold and maintain price action outside of our green, downward sloping line of resistance now hopefully flipped support.

TSLA - ARKK of another DiverWith Impeccable timing, Telsa Witch Kuh Kuh Woods increased the "innovation"
ETF's holding of Tesla.
TSLA is presently off 2.22% and with a break of 500 looing large for the EV edifice
and Consumers pulling back on all segments of spending, TSLA is ripe for a large
decline.
Crude Oil's range has expanded to 42-77. This is not going to assist the TESLA
Witch no way, no how.
NG won't either as 33% is admitted according to TezLabs as the primary input
for Supercharging. It is significantly higher in our humble opinions.
ARKK has been extremely poor at rotating between the speculative and
widely held in their rotations.
91s break on ARKK and Sub 50s should arrive quickly.
TECH Winter is upon, we issued a High for NQ in July, with a decline from
August to October.
We see it shaping up nicely.
Caution warranted - Buy the Dip, which has been the curriculum since
March of 2020 - has come to an abrupt end.

Swing trade opportunity in ARKKthis is a trade set up for the next 6 wks.
closing above 127 makes this obsolete!


Coinbase $COIN making the classic "cup & handle"NASDAQ:COIN could be starting a reversal. The MACD is been going up with the price which today broke above its 50 day MA but it still needs to make the breakout from the $252 resistance. Once that happens could be the start of a good uptrend.
The crypto exchange has had strong revenue and EPS growth, being 2021 its best year. One the first quarter, reported a +844.82% revenue grwoth. All this could be why is one of Ark Invest's favorites. AMEX:ARKK has a +3% allocation making the top 10 holdings of the ETF.
Still is a young stock so, is still very volatil. Always wait for confirmation and there are two key resistance levels that NASDAQ:COIN needs to break.

Time to Add Onto ARKK Position?ARKK appears to have regained bullish strength after rallying above a strong level of resistance now flipped into support. And looks to be currently consolidating on-top of it. All of these are very bullish signs.
Keep an eye on the start of the new week as ARKK has already confirmed a full body candle close above the key weekly support level. How it starts out of the gate this week will be key. If it begins Tuesday in the green, a quick 6-7% pump could happen to retest the upper resistance at around 134.75 - 137.35 approximately.
A long seems safe right now but it will be worth monitoring as the daily RSI is nothing to brag about currently. Tight stop loss at 127.67 would be wise.

ARKK - Projection PathSee attached projected weekly path for ARKK
Top 5 Holdings include:
TSLA - 10.25%
TDOC - 6.09%
ROKU - 5.71%
SQ - 4.65%
SHOP - 4.23%

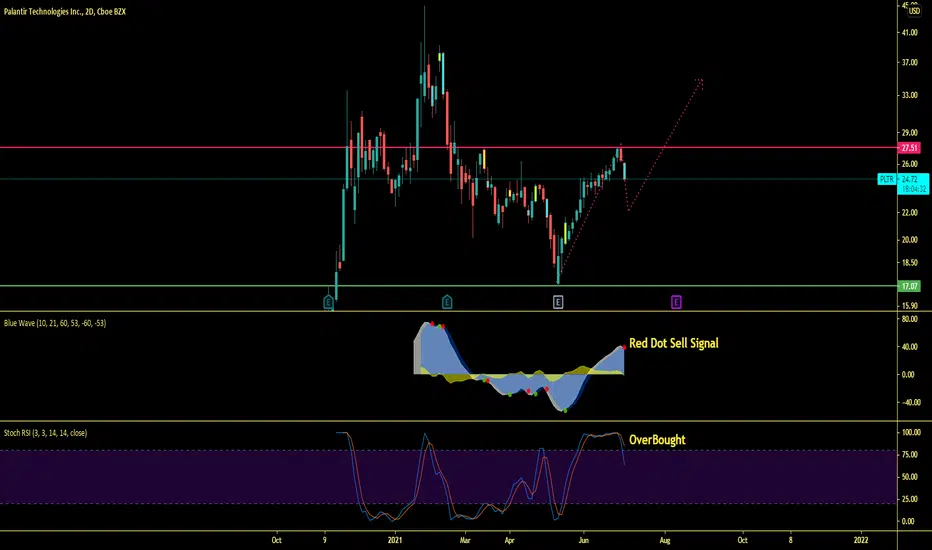
PLTR - Still has potential to go lowerBlueWave Gave red dot sell signal
+ Stochastic RSI was Overbought
Opening (IRA): ARKK August 20th 110 Short Put... for a 1.95/contract credit.
Comments: One of the few remaining exchange-traded funds in my options highly liquid list with 30-day implied greater than 35%. (The others are MJ, XBI, and EWZ). Here, selling the 16; 1.80% ROC as a function of notional risk.

Stocks - ARKK Wyckoff Distribution Sub 40 by EOYIdea for ARKK:
- Classic Wyckoff Distribution.
- Drop begins June 30-Jul 1.
GLHF
- DPT

What Happens From Here Will Be CRUCIAL for Bitcoin (BTC)BTC observed a Wyckoff's Spring * action, bullish, within the consolidation zone.
And with ARKK** is trending higher, we expect to see more demand from here.
If this bullish observation continues, we potentially see BTC breaks above current consolidation zone, back into Mark Up Phase.
Thus, upcoming trading days are crucial to BTC.
================================
* Spring denotes weak supply on the market, where price breaks below support but the supply did not sustain the move to mark price lower.
** ARK Innovation ETF (ARKK) holds emerging technology company stocks, in line with Bitcoin's underlying technology.
ARKK when plotted on the chart, trades in line and leads BTC.
ARKK is trending upwards, is positive for BTC.

Jacob's Trouble - IZRLModel Forecast for ARK Israel Innovative Technology ETF:
- Tribulation and Desolation awaits.
GLHF
- DPT

Closing (IRA): ARKK July 16th 92 Short Put... for a .33/contract debit.
Comments: In for 1.94 (See Post Below), out here for .33; 1.61 ($161) profit per contract. I considered rolling out to August, but the 30-day isn't nearly as sexy as it was.

Let's watch ARKK closely! 👀ARKK is following the same movement seen on several tech stocks today: A possible double top in the 30min, indicating a brief exhaustion, but this is expected.
The 119.15 is the pivot we must see broken as soon as possible. This will lead to a greater upside movement in larger timeframes.
The red line is not going to be an easy foe for ARKK, as it seems the market remembers this price level pretty well. Yes, we also have a small divergence on the RSI, which could make ARKK fall a little tomorrow, but this wasn’t confirmed yet.
On the other hand, if ARKK breaks the resistances mentioned, the 130 is our next stop!
Let’s wait for more confirmation on ARKK!
If you liked this trading idea, remember to click on the “Follow” button to get more trading ideas like this, and if you agree with me, click on the “Agree” button 😉.
See you soon,
Melissa.

ARKK Bearish PatternAMEX:ARKK
Top 3 Holdings
9%~ NASDAQ:TSLA
6%~ NYSE:TDOC
5%~ NASDAQ:ROKU
Going for the retest of the longer-term bearish pattern
