HYPER GROWTH IS BACK IN TOWN, CATHIE WOOD IS IN THE ROCKET SHIPHyper growth has crashed by over 35%, inflation data is not as bad as everyone thinks, 10 year treasuries have pulled back, commodity prices have dropped massively, lumber has dropped from 1700 to 1100, fed likes to print money BRRRRRRRRR. This is not financial advice and I'm not advertising the buy or sale of ARKK etf or its holdings.
ARKK

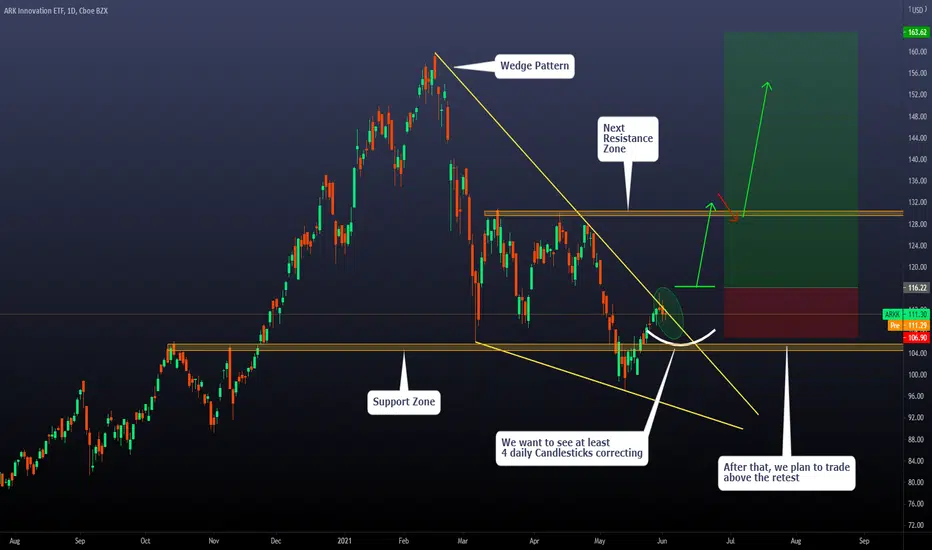
Trading Plan for the breakout on ARKK - Statistical ApproachToday, we will explain our trading idea on ARKK.
What are we observing right now? The price is inside a descending Wedge pattern (106 days correction), and we are observing possible signs of a breakout happening soon. We can see a clear support zone that the price could not break, so we expect a bullish movement towards the next resistance zone at least.
How are we planning to trade this movement? We are waiting for 4 daily candlesticks, at least on the edge of the wedge pattern. (Currently 3) After that, we will set pending orders above the structure, and we will wait for a new local high for an execution. The optimal scenario would be to see a retest of the white curve.
Ok, but why did we chose 4 daily candlesticks and not 7 or 9? Good question, smart guy. Let's take a look at the next chart
Here we have defined ALL the corrective patterns that were ABC clear structures with a duration higher than 50 days at All-time highs level. The conclusion is that after we have the first breakout attempt, we observe a 4 to 8 days correction (daily candlesticks on the edge of the broken pattern) and a new local high as an execution level has been working really well to provide Great setups with huge risk rewards ratio. OF COURSE, the setup failed several times, this is a statistical approach to taking setups, and we should be open to a new fail here. However, our approach is taking good bets in terms of Win rate and R/R ratio. (this means taking several setups to start observing an edge)
The risk we are planning to take on this setup is 1% of our setup, move our stop loss to Break-Even on the next resistance zone, and we will look for a 1 : 10 R/R
Thanks for reading!
ARKK at important resistance..!in the past 37 days, ARKK failed to break above the 200 SMA!
The average 5-day Trading volume decreased from 3.16/D billion in March to 795 million/D.
Wait for rejection and confirmation..!


Is Coinbase undervalued?For Coinbase as a company, we should take a different perspective when evaluating its fair value. I don't think we can use Bitcoin price as a benchmark or surrogate marker of its value. Given the interests in crypto trading, the potential of Coinbase and similar exchanges is huge.
Looking back at almost 2 months' price movement of Coinbase, it seems to be trying to find the floor to pivot and rebound. Volume wise has fizzled, may indicate less volatility.
Immediately still downtrend until the price can stay above last Friday's low.
If it can break above 230, there's a chance for it to reach next resistance around 245-250 range. If price breaks below last Friday's low 228, immediate support at 224 (in hourly chart) or even challenge previous low at 208.

Hanging Man at Resistance before Earnings? Guidance Will Be KeyTough setup. Goodluck all. Be safe. (Opinion Only)

The Week Ahead: ARKK, ARKG, GDXJ, MJ, XBI, XLE, X, CLF, SAVE, FHere's where the premium was at as of Friday's close:
Broad Market Exchange-Traded Funds With 30-Day Implied >20%:
IWM (1/23)
Comments: I have quite a bit of IWM on here, but my order of preference is broad market, then sector, then single name, so am comfortable with adding if we get both weakness and a pop in volatility. IWM/RUT has been fairly rangebound, so it's worthwhile to pop open a chart and see where the bottom of the range is and where any puts you sell are relative to the range between 210 and 235.
Sector Exchange-Traded Funds With 30-Day Implied > 35%:
ARKK (31/45)
ARKG (18/41)
GDXJ (0/40)
MJ (7/40)
XBI (12/38)
XLE (2/36)
Comments: I've got ARKK, ARKG, and MJ July monthlies on, so I may look to add some GDXJ, even though its implied volatility is literally at the bottom of the 52-week range (which is still afflicted by the 2020 pandemic range, so implied volatility rank/percentile aren't all that helpful here), and it isn't exactly weak relative to where it's been. MJ and XBI are currently the most weak out of the group, so I'm personally leaning toward putting on some more XBI, having taken have a June trade last week.
Single Name With 30-Day >50% That Do Not Have Earnings Before Contract Expiry:
X (Steel) (9/74)
CLF (Basic Materials) (18/73)
SAVE (Airlines) (2/55)
F (Autos) (19/55)
OXY (Oil and Gas) (8/53)
SABR (Airlines; Technology) (25/51)
MRO (Oil and Gas) (0/50)
Comments: Given the slim pickings in the broad market and exchange-traded funds space, I've made a list of options highly liquid single name to potentially play while I wait for broad market or sector volatility to return. This list isn't exhaustive, and I've culled out a ton of meme names that have juicy implied volatility but are more likely to become a headache because they're (ironically) too volatile or they're in a space where they're more likely to blow up in my face (e.g., biopharma research and development, crypto).
Pictured here is an X July 16th 22 Short Put (20 delta), paying .74/contract as of Friday close, 3.48% ROC at max/27.6% annualized. As you can see, that play is somewhat close to price action of late, so I'd only put that play on if you're comfortable with potentially taking assignment at 22 and then wheeling it from there. Alternatively, opt for a setup that is consistent with any directional assumption you have as to where U.S. Steel goes from here and that takes advantage of the high implied here.

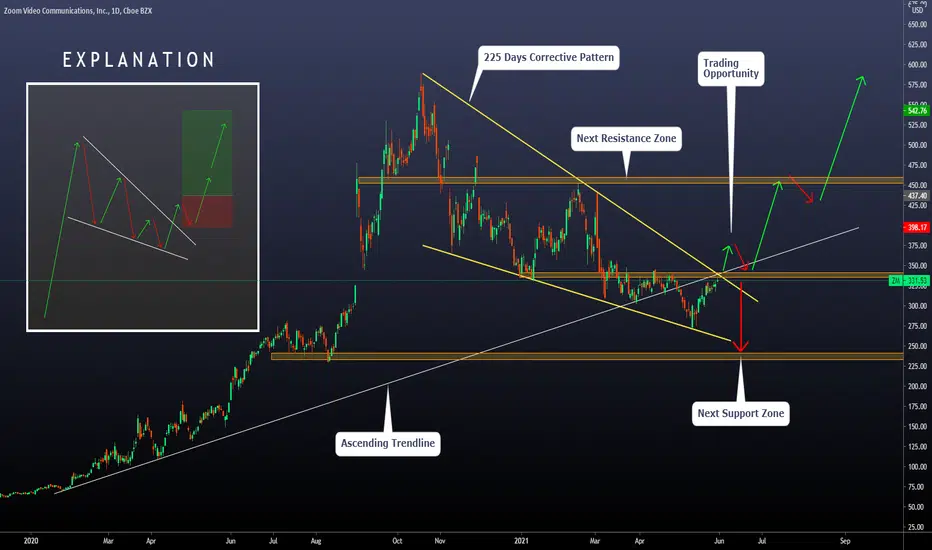
On Zoom, the Corrective Pattern is absolutely finished We have been watching closely zoom for the last weeks looking for the breakout of the massive corrective pattern we are observing right now. After 225 days, the price has tested both sides of the structure, mainly the lower zone. Based on that, we are getting ready for the breakout.
Generally speaking, it is not a good idea to trade a direct breakout of these massive structures. The main reason is that fake-outs are common, and if you are a breakout trader, one of your objectives is to avoid low-quality scenarios as much as you can. For that reason, we have defined a bullish scenario we will be waiting for.
Bullish Scenario: If we observe a breakout of the corrective pattern, we will be waiting for a retest of the broken structure or the resistance level. The formation we want to see must be formed at least for 5 daily candlesticks. Finally, we will trade, as you can see on the EXPLANATION chart. From there, we can aim at two targets, first the next resistance zone and second the previous ATH zone.
Expected Time: If everything goes as expected, we may see a 20 days movement towards the first resistance zone and 50 days towards the new ATH (take these two numbers as approximations)
Bearish Scenario: If the price cannot break the corrective pattern and the resistance zone, we may see a bearish movement towards the next support zone, around 250 - 240. We are not interested in developing any short setups here.
Thanks for reading; feel free to share your view or trading plan in the comments!
ZM Gapped Up Into the Supply Level of $332 - Sell It-Earnings6/1Cathy back to her shannigans.
(Opinion Only)

Closing (IRA): ARKK June 18th 87.96 Short Put... for a .26/contract credit.
Comments: In for 1.94/contract (See Post Below); out for .26/contract with 21 days to go. 1.68 ($168) profit per contract. Still have some July on ... .

ARKK INNOVATION ETF (ARKK) • Volumes suggest bottom may be inARKK volumes on 3D and weekly look particularly interesting.
Nice V-shaped signatures suggest significant sell from weak hand into strong ones.
There is however the possibility of a double bottom formation with lows around 94 but overall I think this correction has ended or at least pretty soon.
Invalidation of this idea is trading bellow 90k until get above 100 again.
The 122 is a significant price level to pay attention. It's the resistance that will become support once broken.

Longterm Resistance Level Here - Seller Ahead of EarningsCathy will likely be a seller here among anyone else smart..
(Opinion Only)

Cathy Strikes Again - Sells Bags to Retail after Pre-Market PumpSame tactics in every stock she owns. Careful on this one ahead of earnings next week.
I'm a seller here.
(Opinion only)

$MARA to the moonLooks like $MARA is ready to fly, and there is a rumor that Cathie Wood will add it to $ARKK


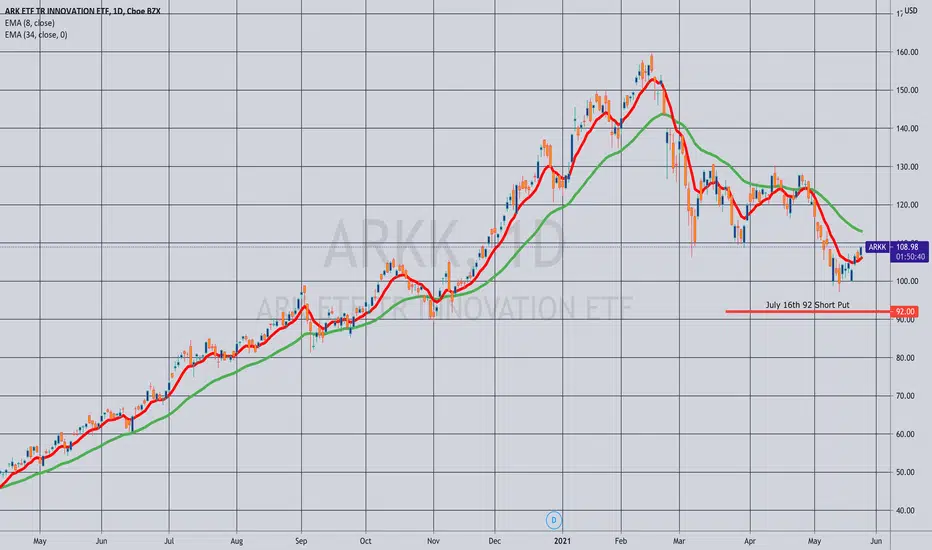
Opening (IRA): ARKK July 16th 92 Short Put... for a 1.94/contract credit.
Comments: Still pretty weak here with fairly high implied volatility (30-day at 46.7%). Selling the 16 delta strike. 2.15% ROC at max as a function of notional risk; 14.8% annualized.
When you forget to update your trading strategies..!One of the most common problems in trading is having a single strategy!
If one strategy works for a while it is very good, but you should be ready for different markets.
We have at least 3 different types of markets! Bullish, Bearish, Correction.
If anyone tries the very same strategy during different types of markets, the result will be disastrous!
It seems ARK Invest still tries the same strategy they used in the past years. But in the past 3 months, they are more than 35% down and they keep ignoring money outflow and profit booking from their funds!
look at the result:
-1 PLTR
2- NASDAQ:VUZI
3- AMEX:ARKK
4- AMEX:ARKF
5- AMEX:ARKG
6- AMEX:ARKW
If you find these chart following the same pattern it is because:
Cathie forgot to ask Brett to update the trading algorithms!
Moshkelgosha

ARKK will sink more if you wait for a while!Why I think ARKK is in Bearish Trend and will sink more:
1- 39% correction in 61 trading days
2- Trading below 200 EMA
3- Negative money flow since March 2021
Main resistance levels: 109-111-117
Support Level: 97-100

ARKK SELL/SHORT ALREADY ACTIVE to 60.50 - 82.50 (Next buy entry)TICKER CODE: ARKK
Company Name: ARK Innovation ETF
Industry: Financial | Exchange Traded Fund | USA
Position Proposed: SELL
Technical Analysis
1. Falling Wedge Pattern (Potentially forming)
2. Large Head & Shoulders (Completed)
3. Fibonacci Retracement at 0.786 is at the market key structure
4. Fibonacci Expansion Safe Take Profit Level 1 (Grey Zone) Also the length of Flagpole
5. Monthly chart was recently in the overbought range
(will be looking for it to fall back in stable range, hence the fall)
Analytical Assumption
Monthly chart has not done any proper retracement
to any market structure hence, we are looking for a deep pullback.
This deep pullback will hit previous resistance which is now the new support
Sell Exit: 110 (would be the nearest)
Buy Entry: NOT READY (60.50-82.50) - Should be ready around August - End 2021 (will update entry potential on closer date)
1st Partial Take Profit: 190.20 (July-End 2022)
2nd Partial Take Profit: 270.00 (2023)
All take profit may differ accordingly depending on available data (NOT ENOUGH AT THE MOMENT)
Stop Loss: 50.5
This chart will be monitored and updated on a closer date or when more data is presented.

The Glorious Days of ARK Invest has been passed...I have published many short analyses on ARKK, and other funds managed by ARK Invest and Cathie Wood.
Some people may think I have personal problems with her or ARK Invest, but this is not true. I do research and analysis in the financial markets since 12 years ago. I started this when I was a 4th-grade medical student.
Since I was, and I am a bookworm, it wouldn't be a false claim if I say I have read more than 100k pages of books and financial articles in the past 12 years! (my best record ever is reading a 680 pages book in less than 2 days)
My favorite Topic in the financial world is Bubbles and the different stages of their development.
Why financial bubbles are so attractive? Because bubbles are the real game-changers! They create new generations of millionaires and billionaires while making many broke! I believe Bubbles are a "Zero Summation" game. From beginning to end no real value is created during any financial bubble!
Those who get on board in the primary stages of any bubble will be the winners if they are not greedy and take the primary capital out of the trade at right time! These people are not average investors, and usually are less than 1% of the investors' population.
I believe ARK invest did a great job between March 18, 2020, to February 16, 2021. ARKK their flagship fund made +305% in profits in less than 11 months! 3 times more than Russell 2000, 4 times more than NASDAQ, 6 times more than S&P 500 and Dow jones!
From a financial point of view, this is one of the best performances ever, no doubt. They achieved this in one of the best bullish rallies ever, the second-best in the last 35 years, after that 9 months from June 1999 to March 2000 when NASDAQ experienced a +140% growth. Do you know what happened after that? NASDAQ corrected more than 83% in the next 31 months, in the financial world it is called the ".com bubble" since then.
NASDAQ Performance in the last 35 years:
NET NET Fund an Example of "Thematic Investing" 24 years ago
It would be interesting for you to review the NET NET fund story between 1997 and 2000. The NetNet Fund, which is focused on Internet stocks, for three years rode the tech bubble into the stratosphere and ballooned from about $10 million in assets in 1997, a year after its inception, to about $12 billion when Munder closed the fund in April 2000.
Could ARK Invest be the next NET NET fund?
I believe to answer this question we should review their portfolio management when the market went south. For instance:
A: ARKK Feb 19th 2020 - March 18th 2020:
B: ARKK Sep 2018 - Dec2018:
C: ARKK Jan 2016 - Feb 2016
I think it would even be better to look at a bigger picture and check the ARKK performance from start in October 2014 to February 2021:
The bright side +668% gain in the first 6 years. (76 Months)
The dark side: losing 40% of whatever they had achieved in the past 6.5 years in the last 4 months:
By now you must know that she and her "Thematic Investing" project is in very very big trouble! Although she successfully managed to manipulate the market using the power of social media in the past 6 years, she forgot that this only works in a Bullish market. Usually, when bullish markets reach their ends, they start correction from the most ballooned assets!
In our case, you can check EV makers and Biotechnology companies! Most of them corrected more than 50% in the past 4 months!
For instance Tesla and Crisper, you can find here stories about how promising the future will be for these two companies:
Tesla: lost 39% of its value in the past 4 months:
Crisper: lost 56% of its value in the past 4 months:
I think I provide enough examples to show that the ARK Invest management team has very good performance in bullish rallies but they have no skill to manage their fund during previous corrections in the market! In the above example, you see during the past major corrections they always underperform and correct more than all four major indexes.
Things will become more interesting when you notice she invested 99.72% of the available cash, and she hopes for market recovery! The top 10 holdings of ARKK with almost 50% weight, have lost their value between 18-52% in the past 3 months!
If you patient enough to read this article you must know I provide evidence for all the claims!
In conclusion, I believe ARK Invest did not invest in the growth stocks because they believe in the future of these companies, they invest in these companies because they knew they were able to sell their stories to inexperienced investors using their pyramid social media networks and on the top of all Youtube!
The very same method used by Elon Musk in the cryptocurrency market using his Twitter account and Chamath Palihapitiya using SPACS...!
Don't forget the author of this article warned everyone about
1- EV makers correction as early as February 18th, 2021:
2- Bitcoin Crash as early as April 13th, 2021 when it was 63.8K:
3- Tesla correction as early as February 17, 2021:
4- ARKK correction February 22, 2021
5- The cryptocurrency market crash on May 14, 2021, exactly 72 hours before it happened. ( I updated my status on all my social media and TradingView and warned about the Whole Cryptocurrency Market will Crash soon)
Moshkelgosha

Will Tesla hold?...A weekly chart of TSLA will show us the longer term trend, which fate could be tested at the $550 level, which is coincidental with the 61.8% Fibonacci Retracement, a break below this level suggests the next target on the downside is $330 approximately.
There is a slight divergence with the RSI, when you take a look at the last bottom. (Bearish)
I will be keeping this on a close watch.


The Week Ahead: ARKG, ARKK, MJ, ARKQ, GDXJ, IWM/RUT PremiumHere's what's paying for premium sellers as of Friday's close ... .
For those of you not familiar with my general process, my general order of preference is to trade (a) broad market; (b) sector exchange-traded funds; and (c) single name, in that order. If broad market isn't paying, I look at exchange-traded funds, and -- if those aren't paying -- I look at single name. This week, I think that there are opportunities to sell premium in at least sector exchange-traded funds, so I don't feel the need to delve into what single name is paying and haven't bothered to screen single name here.
In any event, I first screen out exchange-traded funds* that do not have a 30-day implied volatility of at least 35%.
Then, I price out what the 45 day at-the-money short straddle is paying as a function of strike price with the notion being that if the short straddle is paying, then most other premium selling setups I undertake will also be paying, whether it be short puts, short strangles, iron condors/flies, or short verticals/credit spreads. Here, my cut-off is generally a risk premium (credit received)/short straddle ratio of greater than 10%.
In light of this, I probably wouldn't bother playing FXI here, even though it has a 30-day implied of 36% and one that is relatively high in the range (at the 63rd percentile) because it just isn't paying enough -- 6.18% as a function of strike price. In comparison, it looks like "The Ark Complex" is paying, even though some expiry availability/liquidity makes the exchange-traded funds in this grouping less than ideal to trade.
Exchange-Traded Funds Screened for Options Liquidity and 30-Day Implied >35%:
ARKG (Genomics) (60 rank/61 30-Day): June 18th (33 Days)** 77 short straddle, 9.20 at the mid price, 11.95% as a function of strike price, 132.2% annualized.
ARKK (Innovation) (52/54): July 2nd (47 Days) 104.5 short straddle, 14.45 at the mid, 13.83% as a function of strike price, 107.4% annualized.
MJ (Cannabis) (<1/42): July 2nd (47 Days) 19.5 short straddle, 2.60 at the mid, 13.33% as a function of strike price, 103.5% annualized.
ARKQ (Robotics) (51/39): June 18th (33 Days)*** 79.34 short straddle, 6.75 at the mid, 8.51% as a function of strike price, 94.1% annualized.
GDXJ (Junior Gold Miners) (7/37): July 2nd (47 Days) 51 short straddle, 5.58 at the mid, 10.94% as a function of strike price, 85.0% annualized.
XME (Metals and Mining) (34/37): July 2nd (47 Days) 45 short straddle, 5.95 at the mid, 13.22% as a function of strike price, 102.7% annualized.
EWZ (Brazil) (14/37): July 2nd (47 Days) 37 short straddle, 3.50 at the mid, 9.56% as a function of strike price, 74.2% annualized.
FXI (China) (63/36): July 2nd (47 Days) 44 short straddle, 2.72 at the mid, 6.18% as a function of strike price, 48.0% annualized.
GDX (Gold Miners) (30/35): July 2nd (47 Days) 38 short straddle, 3.53 at the mid, 9.29% as a function of strike price, 72.1% annualized.
Broad Market Exchange-Traded Funds with 30-Day >20%:
IWM (Russell 2000) (16/27): July 2nd (47 Days) 221 short straddle, 15.68 at the mid, 7.10% as a function of strike price, 55.1% annualized.
QQQ (Nasdaq) (14/24): July 2nd (47 Days) 326 short straddle, 21.18 at the mid, 6.50% as a function of strike price, 50.5% annualized.
* -- For single name, the cut-off is 50% implied or greater; for broad market, 20% or greater. Broad market just tends to be less volatile than sector, which -- in turn -- tends to be less volatile than single name.
** -- There is currently no weekly contract near 45 days' duration, so using the monthly here.
*** -- As with ARKG, there is currently no weekly contract near 45 days, so using the June monthly here.
