$ARKK — Bearish Cup & Handle PotentialThis potential bearish cup & handle is only valid only below $56, so keep an eye out for this one.
ARKK

It seems ARK invest is not able to read the inflation story ..!Being on the wrong side of the equation will cost you a lot..!
Cathie Wood's performance history in 2008 showed that..!
I think she has a high chance to break her -48% (negative) return in 2008, after 14 years..!
Why?
in the first 3 months of 2022, her flagship is down 35%..!
Forecast:
ARK invest will not survive 2022..!
Best,
Dr . Moshkelgosha M.D
DISCLAIMER
I’m not a certified financial planner/advisor, a certified financial analyst, an economist, a CPA , an accountant, or a lawyer. I’m not a finance professional through formal education. The contents on this site are for informational purposes only and do not constitute financial, accounting, or legal advice. I can’t promise that the information shared on my posts is appropriate for you or anyone else. By using this site, you agree to hold me harmless from any ramifications, financial or otherwise, that occur to you as a result of acting on information found on this site.

Cathie Wood’s Oil price prediction..!To all those who blindly follow someone:
I warned you at least a year ago, ARK invest is nothing but a social media campaign to create bubbles..!
Look at the oil 125 price , and ask yourself:
What if all Cathie Wood’s prediction end the same way?
I recommend to watch her CNBC interview to see she is in total denial phase..!
Like a very rookie trader..!
youtu.be
And on last question:
Is it possible that you do not know if the person who provides the seed money for your first 4 Funds is still ARK’s shareholder or not???
Wood said she had sent Hwang a note "wishing him well" after the Archegos collapse. Wood said she had no idea if Hwang had remained a shareholder in Ark ETFs.(yahoo)
www.yahoo.com
Best,
Dr. Moshkelgosha M.D
DISCLAIMER
I’m not a certified financial planner/advisor, a certified financial analyst, an economist, a CPA, an accountant, or a lawyer. I’m not a finance professional through formal education. The contents on this site are for informational purposes only and do not constitute financial, accounting, or legal advice. I can’t promise that the information shared on my posts is appropriate for you or anyone else. By using this site, you agree to hold me harmless from any ramifications, financial or otherwise, that occur to you as a result of acting on information found on this site.

ARKK != InnovationIf you don't want to accept the reality that Ark invest is in a downtrend, you will pay for it..!
this is its weekly chart:
2 weeks ago Cathie Wood told CNBC: " People betting against us are shorting innovation"
No, we do not, we bet against the social media created bubbles,
We bet against your old investing style that failed in 2008 and pushed you out of business with -a 48% loss back then..!
Millennials could be fooled by this Sci-Fi story you guys publish every now and then, but we did our research..!
And we make money while you lose it..!
Reference Link:
youtu.be
Best,
Dr. Moshkelgosha M.D
DISCLAIMER
I’m not a certified financial planner/advisor, a certified financial analyst, an economist, a CPA, an accountant, or a lawyer. I’m not a finance professional through formal education. The contents on this site are for informational purposes only and do not constitute financial, accounting, or legal advice. I can’t promise that the information shared on my posts is appropriate for you or anyone else. By using this site, you agree to hold me harmless from any ramifications, financial or otherwise, that occur to you as a result of acting on information found on this site.

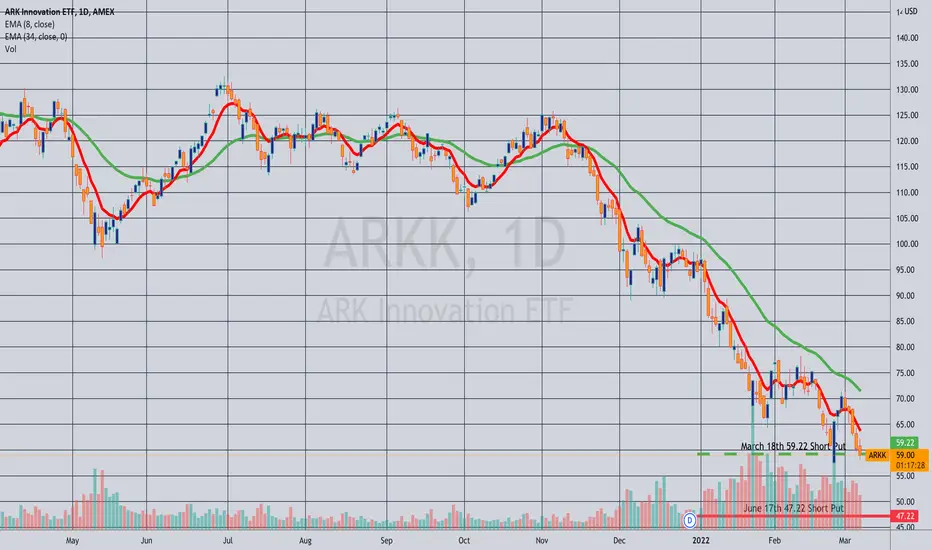
Rolling: ARKK March 18th 59.22 Short Put to June 47.22... for a .05 credit.
Comments: Giving myself more room to be wrong on the put side ... .
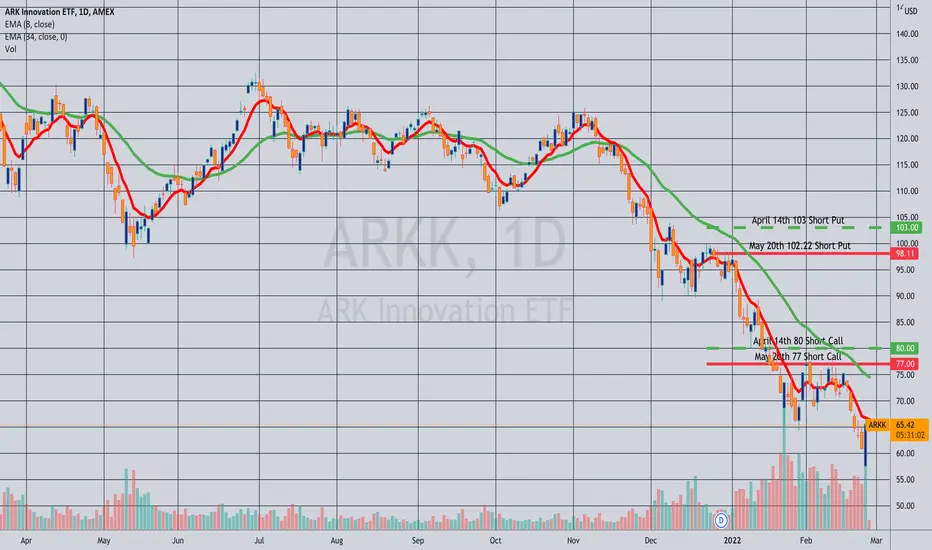
Rolling: ARKK May 20th 77 Short Call to May 20th 64.22... for a 2.85 credit.
Comments: Total credits collected of 30.85 on what is now a 38-wide inverted, so just looking to close out the entire position for less of a loss than what it is currently at this point.

Opened: ARKK May 20th 49.22 Short Put... for a 2.14 credit.
Comments: Total credits collected of 28.00 on a 25.22-wide inverted with a put side break even of 74.22. Ordinarily, I would have rolled out the shorter dated March 18th 59.22 at 50% max, but I sold it for 1.83 and it finished the day at 2.03 with 15 days to go, so will just look to take it off on approaching worthless if I get an opportunity to do so.


How my trading plan looks like on US500A few days ago, I developed bearish setups on the index, and my setup was closed on break-even, which means that the price moved in my expected direction, and I decided to protect my setup by moving my stop loss to the entry-level. After the reversals we observed on Thursday and Friday, the price reached my entry level, and the setup was closed on 0
From here, this is what I'm planning in terms of bullish opportunities:
First of all , I will avoid trading below the current descending trendline.
Second , I want to observe a clear breakout of the current trend, and I will wait for a correction before new setups.
As you can see in this picture, after we have strong bearish movements, there is a consistent trading opportunity happening after the breakout of the trendlines, where we tend to observe small daily corrections. From there, I will work on new setups towards the following resistance levels. In the meantime, I will keep waiting.
Feel free to share your view and charts in the comments!
*The information and publications on this post are not meant to be, and do not constitute, financial, investment, trading, or other types of advice or recommendations. This is for educational purposes only.

Price seem well supported. Bias on upsideARKK ETF used to be best performing ETF in year 2020. However due to rate hike situation, most of the innovation companies invested in this ETF question by the capability to survive. Therefore we can see a huge drop thereafter.
However, the price have dropped more than 60% since it peak in Feb 2021 supported by 23.8% Fibo..
We are looking at two price level between $50 - $60 for its rebound. If price fail to support between these two level, we may see around $35+

Rolling: ARKK April 14th 80C/103P to May 20th 77P/102.22C... for a .93 credit.
Comments: There isn't much extrinsic left in the deep in-the-money short put, so rolling it out to May to collect additional credit and reduce cost basis further. Total credits collected of 25.86 on what is now a 24.22 inverted with a break even of 76.36 relative to where the underlying is currently trading at 65.37.
I'll continue to scalp around this position to reduce cost basis further, but have been working it for several cycles already, so it's more about mitigating loss at this point than attempting to make money on the position (although you never know).
QQQ Tech - Neutral, No Strong Read YetThe social inefficiency of capitalism is going to clash at some point with the technological innovations capitalism engenders
and it is out of that contradiction that a more efficient way of organizing production and distribution and culture will emerge.
Every non-Marxist economic theory that treats human and non-human productive inputs as interchangeable
assumes that the dehumanisation of human labour is complete.
But if it could ever be completed, the result would be the end of capitalism as a system capable of creating and distributing value.

2 Years later, ARKK is in the same place. Today I will update my view on ARKK from the previous post I made.
I found it super interesting to see how one of the most renowned assets in the post-pandemic era has erased ALL its gains from the beginning of the bear market back in February 2020 until now.
From a logarithmic perspective, we can see that the current decline is the deepest one and almost doubled previous declines.
Now I would like to go into technical elements and the situation where we may have interesting trading opportunities.
I am still paying attention to the internal descending trendline. Trendlines are incredible tools to help you avoid getting into the market at the wrong moment. For example, here, the descending trendline can be interpreted as "Below the trendline, avoid bullish setups. Above the trendline, start thinking in bullish setups."
But that's not all; I don't want to see a breakout of the descending trendline only. I want to observe a clear correction with the proportions you can see on the circle. IF that happens, I will trade on a new local high towards the higher zone of the descending channel. If nothing of that happens, because the price keeps falling into the ugliest correction of all, I would stay on the sidelines until the technical elements confirm that we are in a good situation to develop setups.
Thanks for reading; feel free to share your view and charts in the comments.

Buy when others are greedyTesla is a big holding of arkk and now breaking down. But if tesla can hold we might have seen the low. Otherwise look at the next fib level.

#NASDAQ - CRASH - 12.000 INCOMING? Nasdaq broke the recent correction lows and closed right at session lows.
If we just saw the first wave of a correction, and after that, the relieve rallye to the 50retrace, we now might be poised for the second leg down.
Copy the first leg, measure it from the high of the relieve rallye and you end up retesting the old ATH at 12k, what clearly is a major inflection point in the Nasdaq chart.
That would probably be an insane buying oportunity, especially in some - at that time probably completly obliterated - high growth stocks.
---- If you wanna protect your portfolio, wait for Nasdaq to retest 13.700 from below and get rejected, that would be your lowest risk/reward short entry. Im not posting full short setups though, cause of reasons :D ----
STAY SAFE out there and good luck on your trading.

Nothing left to brag about..!In an interview with Bloomberg, the ARK Invest founder and CEO predicted that her flagship fund would generate 40% annual returns over the next five years, a big jump over her previous target of 15% to 20%.(Fortune)
Here I compare her 40% prediction with her previous prediction of 15% compound annual rate of return.
In the 40% scenario it will take 3 years to get back on the previous all time high, assuminng it start climbing up right now..!
In the 15% scenario it will take 7 years to get back on the previous all time high, assuminng it start climbing up right now..!
But we all know it is not finished yet..!
But
How long ARK investors will stay calm???
I do not think ARK invest could survive 2022..!
This is not the prediction of a random guy, this is the prediction of a man who see it is coming at least a year ago:
April 29th, 2021:
Title: Apocalypse of ARK invest
Best,
Dr. Moshkelgosha M.D
DISCLAIMER
I’m not a certified financial planner/advisor, a certified financial analyst, an economist, a CPA, an accountant, or a lawyer. I’m not a finance professional through formal education. The contents on this site are for informational purposes only and do not constitute financial, accounting, or legal advice. I can’t promise that the information shared on my posts is appropriate for you or anyone else. By using this site, you agree to hold me harmless from any ramifications, financial or otherwise, that occur to you as a result of acting on information found on this site.

Only impossible is impossible in the market..!A new trend in the market:
Stocks slip below their pre-pandemic prices easily in 2022..!
IF ARKK, Meta(FB), BABA, NFLX, SPOT, PYPL, SQ, ROKU, and many more companies are now trading below their pre-pandemic prices
It is very likely the same thing happen to tesla in the Future ..!
FB:
NFLX:
BABA:
ROKU:
PYPL:
Finally, based on Cathie Wood's research ARK investment will experience a 15% growth rate in the coming years, which means it will take
7.5 years to get back to the 169.7 all times high..!
Best,
Dr. Moshkelgosha M.D
DISCLAIMER
I’m not a certified financial planner/advisor, a certified financial analyst, an economist, a CPA, an accountant, or a lawyer. I’m not a finance professional through formal education. The contents on this site are for informational purposes only and do not constitute financial, accounting, or legal advice. I can’t promise that the information shared on my posts is appropriate for you or anyone else. By using this site, you agree to hold me harmless from any ramifications, financial or otherwise, that occur to you as a result of acting on information found on this site.

don't kill the messengerWell. i know that not all the people agree in how Cathie Wood handle the ARK fund investments, sometimes me neither, but i hope that she takes profits when she sale something, the true is that we have a market full of opportunities and i think a group of intelligent people driving ARKK can see the same. We have two options for this fund, going to $20s or bounce at these level. technically there is symmetrical perfect gigantic bull flag that is like an aberration, and i never seen something so perfect, perfect parallel lines 25 degrees each, the flag has a hidden message and maybe it's a bull trap and will end converting in a wedge. at the end the rewards will come like with other market opportunities.

$ARKK ETF AnalysisThe Exchange Traded Fund ARKK is now trading above a key level in the market, which might give us a possible rejection at 61.18
below this key level is an attractive buying zone according to previous year price action after the COVID-19 crash
consider this as a long term investment especially while buying this dip but wait for a bottom confirmation pattern (double bottom, wicks rejection at demand level, triple bottom...)

ARKKHoping for a bounce here on ARKK around 54-60$
This thing is heavily oversold. ROKU is a POS and likely will continue towards 90$.

Another Potential Mirror Pattern $ROKU targets $70Another potential Mirror Pattern on $ROKU. Targets 70 measuring from the center of the mirror. Not great news for $ARKK.
I was not watching ROKU actively - this could have been seen as a possibility as early as the retrace back to 266!!

SARK the most profitable ETF ???? SARK or The Tuttle Capital Short Innovation ETF offers investors access to a short vehicle that may otherwise be difficult to execute on their own.
The fund attempts to achieve the inverse (-1x) of the return of the ARK Innovation ETF for a single day, not for any other period.
So far, so good, from November till February the fund has a return of 68%.
Looking forward to read your opinion about it.

Opening: ARKK April 14th 50 Short Put... for a 1.47 credit.
Comments: Adding to my ARKK position on weakness. Total credits collected of 24.93 with a 78.07 break even relative to where it's currently trading at 66.92. (Ugh). This also wouldn't be bad as a standalone trade, with rank/implied at 78/72, paying 1.47 on buying power of 5.12 (28.7% ROC at max).
