#AR/USDT Gearing Up for a Powerful Wave 3 Launh#AR
The price is moving within an ascending channel on the 1-hour frame, adhering well to it, and is on its way to breaking strongly upwards and retesting it.
We have support from the lower boundary of the ascending channel, at 5.50.
We have a downtrend on the RSI that is about to break and retest, supporting the upside.
There is a major support area in green at 5.90, which represents a strong basis for the upside.
Don't forget a simple thing: ease and capital.
When you reach the first target, save some money and then change your stop-loss order to an entry order.
For inquiries, please leave a comment.
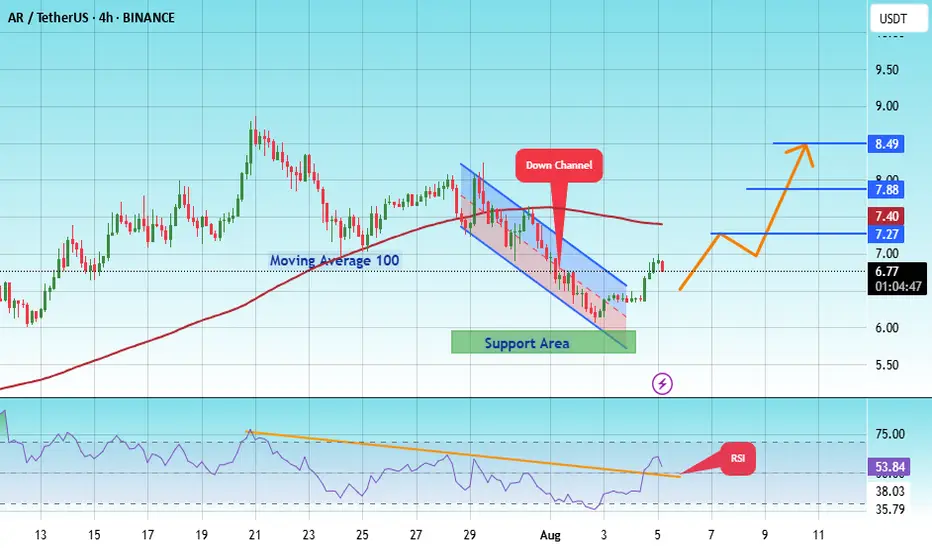
We have a trend to hold above the 100 Moving Average.
Entry price: 6.80.
First target: 7.27.
Second target: 7.88.
Third target: 8.50.
Don't forget a simple thing: ease and capital.
When you reach your first target, save some money and then change your stop-loss order to an entry order.
For inquiries, please leave a comment.
Thank you.
ARNBTC
#AR/USDT#AR
The price is moving in a bearish channel on a 4-hour frame and is holding it strongly and is about to break it upward
We have a bounce from the green support area at 23.00
We have a tendency to stabilize above the Moving Average 100
We have a downtrend on the RSI indicator that is about to break higher and supports the rise
Entry price is 24.00
The first goal is 31.11
The second goal is 35.77
The third goal is 41.30

Delisting ARN/BTC - stay aware ! #arn #crypto #bitcoinThis is called falling off a cliff . ARN just got delisted from Binance , though technically it happens on the 20th of July . But you can clearly see the whole chart looks like it's taking a hard dive down ! Don't touch this . In case you didn't know then let me tell you - "Never put all your eggs in one basket " . That way if one of your holdings tanked like this you would still be OK with your other coins ( and no , I'm not holding ARN . ) DIversify your holdings and your trading strategy . Have a plan ! Be cautious too . One safe strategy is to go where the volume is ... and also start trading some of those coins that appear to be "not as joined" to Btc swings , in other words , coins that have their own traders that favor that project.

ARN/BTC (Strong Selling Pressure)ARN/BTC
-after the Binance news to delist this coin
-the price has dropped down to 400 sat
-but eventually when shooting up back to 1600 range
-there is a strong sell pressure
-I don't think this current price level will hold
-the important zone to watch is 1200-1000 range
-where we could see another potential reaction bounce up
-do not trade this coin if you don't follow risk management

Delisted by Binance RIPIt was fun while it lasted. 152% pump from the bottom of May 2020.
www.binance.com

Aeron (ARN) Perfectly Bullish, Goes For More |Next Target MappedAeron (ARNBTC) cements its uptrend by printing a higher high... This is a very strong signal.
Higher highs and higher lows are what we are seeing here with bullish indicators.
On this chart I would like to show the next target, sitting at 20% from the current price followed by 68%.
Previous chart | Jun 7
Remember to hit FOLLOW if you want to receive updates on these charts.
Namaste.

Failure of the downward trend line by price upwardsUpward MACD, downward price
Failure of the downward trend line by price upwards

LONG - ARN - Trading OpportunityBINANCE:ARNBTC on a symmetric triangle formation, looking ready to break upwards.
Would buy on a breakout with a stop below.
Entry: 0.00001850
Target 1: 0.00002034
Target 2: 0.00002191
SL: 0.00001784
CryptoCue is not providing investment advice and is not taking subscribers’ personal circumstances into consideration when discussing investments. Investment involves a high degree of risk and should be considered only by persons who can afford to sustain a loss of their entire position.
CryptoCue is not registered, licensed or authorized to provide investment advice and is simply providing an opinion, which is given without any liability or reliance whatsoever. The information contained here is not an offer or solicitation or recommendation or advice to buy, hold, or sell any security. CryptoCue makes no representation as to the completeness, accuracy or timeliness of the material provided and all information and opinions provided by CryptoCue are subject to change without notice and provided on a non-reliance basis and without acceptance of any liability or responsibility whatsoever or howsoever arising. You hereby irrevocably and unconditionally waive, release and discharge: (a) any and all accrued rights and/or benefits you may have against CryptoCue in respect of any opinion expressed or information conveyed by CryptoCue at any time; (b) any and all Claims you may have against CryptoCue arising out of any opinion expressed or information conveyed by CryptoCue at any time; (c) CryptoCue from all and any claims (whether actual or contingent and whether as an employee, office holder or in any other capacity whatsoever) including, without limitation, Claims you may have against CryptoCue arising out of any opinion expressed or information conveyed by CryptoCue at any time. ("Claims" shall include any action, proceeding, claim, demand, judgment or judgment sum of whatsoever nature or howsoever arising.) You hereby agree to indemnify and hold harmless CryptoCue in respect of any and all Losses paid, discharged, sustained or incurred by CryptoCue in the event of bringing any Claim against CryptoCue. (“Losses” shall include any and all liabilities, costs, expenses, damages, fines, impositions or losses (including but not limited to any direct, indirect or consequential losses, loss of profit, loss of earnings , loss of reputation and all interest, penalties and legal costs (calculated on a full indemnity basis) and all other reasonable professional costs and expenses and any associated value-added tax) of whatsoever nature and/or judgment sums (including interest thereon).

BULLISH TREND IS POSSIBLE! "HEAD AND SHOULDER" PATTERN CREATED!Perfect "HEAD AND SHOULDER" pattern in ARN/BTC on 1hr chart.
Buy below : 1850
Sell 1st target : 1930
Sell 2nd target : 1060


Aeron (ARN) Breaks MA200, Next 75% Target MappedAeron (ARNBTC) is looking nice now that prices are finally moving above MA200 (0.00001534).
We are looking at the daily (D) timeframe, meaning that each candle on the chart goes for 24 hours.
Breaking above MA200 is only confirmed when the daily candle closes at 00:00UTC.
A bullish close above this level can lead to additional growth.
Here we have 75%+ mapped on this chart for the next target.
This is not financial advice.
Remember that you need your own plan/strategy if you decide to trade.
Always do your own research.
Namaste.


arn/btc(4 hr), cypher pattern, 20-24% moveI have already published my longer-term view which has the targets much higher but this one is a shorter-term target.
I AM NOT A FINANCIAL ADVISER, DO YOUR OWN RESEARCH!

ARN-BTC ready for a 100% pump!?>>> Weekly closed above 21 MA.
>>> Breakout from falling wedge with daily candle close.
>>> A daily close above 200 MA will makes this bullish.
>>> 1st Resistance: 2350-2500.
>>> Main resistance: 3150-3450.

ARN/BTC (WEEKLY), FALLING WEDGE BREAKOUT, BULL DIV, ABOUT 2XThe extrapolation of the wedge puts my main target at about 3XXX sats, nearly a 2x!
I am not a financial adviser, do your own research!

$ARN, Flipped ~1300sats into support w/ spikes in volume..$ARN
Flipped ~1300sats into support w/ spikes in volume..
UCTS Showing 1D Buy signal & LTFs
If continuation happens (volume keeps 📈), then next target should be ~1700sats (+20%)
If you are willing to take a chance here, add as close as possible to support level...
#ARN


#ARN/BTC (June 06)ARN is quite strong and it is mostly ready to breakout. Its targets should be at least 1600sts and 2000sts

ARN/BTC - E2E Setup on the ichiA nice E2E oppotunity presenting itself on the 12hr all signs are checked off!
Wait for close of the 12hr and if its in the cloud we have our E2E!
Trade, Chart, Learn, Repeat
Coach K
@coachkcrypto

ARN/BTC (Bullish Descending Pattern)ARN/BTC
-a bullish descending channel is forming
-a big spike in volume before a potential breakout
-two entry point strategy is here
-buy on current price levels and SL below swing low
-or buy during the breakout of the pattern
-both have risk involve and reward
-please apply risk management


Aeron Trade Signal @alanmasters [ARNBTC](403%)Aeron is starting to move. Prices are now above EMA50 and can easily move higher.
Below you have the full trade numbers.
----------
Trade: Aeron | ARNBTC
BUY: 0.00001450 - 0.00001550
TARGET:
1) 0.00001900
2) 0.00002250
3) 0.00002500
4) 0.00002820
5) 0.00003200
6) 0.00003400
7) 0.00003750
8) 0.00004350
9) 0.00004750
10) 0.00005300
11) 0.00006800
12) 0.00007750
PROFITS POTENTIAL: 403%
(Price at writing 0.00001541)
STOP: Close weekly below 0.00001300.
----------
Thanks a lot for reading.
Namaste.
----
This is not financial advice.
All the information shared here and/or by Alan Masters is intended for entertainment and learning purposes only.
Trade at your own risk.

