Bitcoin Price Outlook 27 December 2020 — BTC DOWNFrom picture above you can see my expectations of Bitcoin.
Simply I think price still will be in little upside move after short-term correction.
This might be a last up-move before some good correction appear.
This trading zone is considered high risk, but what we can do about it?
Artemcrypto

Bitcoin Flag 23 December 2020 — will go UPPrice of bitcoin consolidated in Flag shape, well know pattern, this is bullish pattern, so most likely we will go up.
Just to remind you previous updates going according to the plan:
23 Decemeber Market Review, you should watch it, still actual info
Long term analysis for bitcoin price prediction
Previous btc update, active
SL and Target levels you can find on the chart.
Best regards,
Artem Shevelev

Bitcoin Market Review (#1) 23 December 2020Hello! in this video you can find bitcoin and major crypto prices forecast.
In today video
BTCUSDT
ETHUSDT
BNBUSDT
LTCUSDT
XRPUSDT
If you find this content reliable, press Like!

Bitcoin 1h Price Outlook 22 December 2020Welcome in 22 December update, here is previous updates to remember you overall direction:
21 December EW count
15 December view possible fractal
Here is the video about Price action Trend Line tool, you should check it
Current BTCUSD price action looks like we can rise from here upside, but be carefull and watch 22k zone, if price break it, we will go a little lower 21-21.5k
Target for rise is around 25-26k.

Bitcoin Price Prediction 2021 Elliott WaveHere is update to my Elliott Wave count for Bitcoin price of 2020, the count can potentially predict 2021.
In past we had Panic Phase, I think from November 2019, March 2020 (COVID crisis) till late May 2020 (Halving Worries).
I think right now we going trough Media Attention phase, from many places we can see news, articles, videos about Bitcoin, Mining and Cryptocurrencies. This topics covering investing, breakeven of the mining (retail), farming, and earnings from DeFi projects, etc.
After breakout from 20k, we see a new wave of traders joined the market, as well as old ones coming back to breakeven from losses, or making good profits.
I think we might retest 20k or below as possible Demand Zone for 2021. On chart the explanation for Spot Buy.
Best regards,
Artem Shevelev

ADA Price Outlook 18 December 2020ADA price action following in the rising channel. I will expect breakout downwards, measured channel we can expect some sort of levels, and combining with Fibonacci retracement, we can get deeper understanding exact zone.

XRP 4h Price Outlook 19 December 2020Hello! Price of XRP calmed down after rise from $0.25 to $0.77. This opens new opportunities for traders, as price went to sideways range. Current range approaching its end and we can see trends changing.
Now it is possible long entry for short-term traders.
Stop loss below entry with safe margin. Affordable risk is recommend.

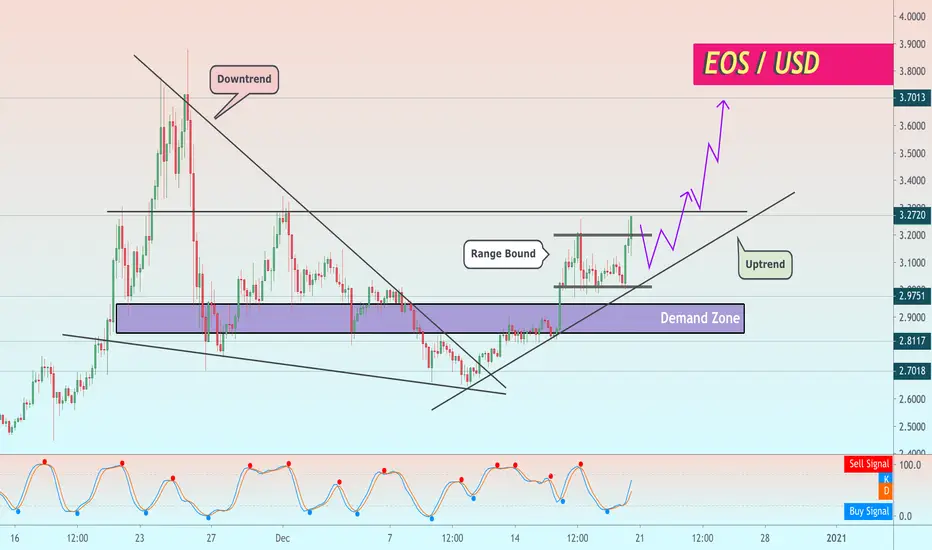
EOS 4h Price Action Outlook 20 December 2020Price of EOS is near important resistance, there is great opportunity to take profit if price break it.
In case of breakout there is a level of resistance $3.7.
Demand zone located below current uptrend line. This zone is useful for mid-term traders/investors.
LINK 4h Price Action Outlook 20 DecemberMany people following LINK precisely, and I decided to check out price action, and find it beautiful and looks pretty much bullish.
After several Wedge patterns, price ready to the pump more.
Take profit levels on the chart. Stop loss below Wedge support is required.
Stoch RSI oversold in current wedge.

Binance Coin W Price Outlook 20 December 20202Binance Coin price action on weekly timeframe I find quite interesting.
On chart we have sets of Weekly lows and levels, and Candlestick pattern which appearing here on W timeframe is possible Hammer candlestick, which is well know reversal pattern.
Below, on Standard Deviation indicator you can see we have oversold areas with arrows and they often represent actual low of the price.
BNBUSD price currently sitting at 34$ high, and this is quite big resistance, and not best point to buy, but next price action will depend on bnbbtc ratio IMHO.
If the price of bnbbtc will increase from this reversal signal, I think BNBUSD price can possibly cost over 40$ and even 50$. Well, let's see.

Price Action Basics: 1 Tool to Rule them AllIn this vid I will explain about Price action Basic Tool.
This tool is exceptional and most used in trading and technical analysis.
This video will help new traders how to analyse chart and find trades according to price action.
Bump Like if you enjoyed the video and find it useful.
Best regards,
Artem Shevelev

Bitcoin Price Outlook 17 December 2020Bitcoin everywhere, staring at price like crazy from 1m and 5min charts :D
Just one hour ago price broke channel. I think it is important trading signal.
The chart explains buy entry for short-term scalpers in 1h timeframe and here is few pics from the higher timeframes.
Using Bollinger Bands for reality check
Subscribe to receive updates
Best regards,
Artem Shevelev

Magic 0.618 — Bitcoin Bull Trend 2019 vs 2020/21 Hello!
Bitcoin price seems stuck at 20k resistance zone. But here is a beautiful thing I have found on the chart.
Current price action can be compared to 2019 rally. I showing beautiful fractal, and what important is — the number 0.618. You may find I put Fibonacci retracement on the right screen in 2019 chart. The Fibonacci ruler put between swing high and low (number 1 at support line), and magic is 0.618 point (golden ratio) sets exactly at touch number 3 on resistance line, and the numbers are not random.
I think I noticed similar sequence of touches to the trend line Blue and Red, and marked them with numbers.
So the same analysis I send to the left screen on 2020/21 chart, and it following same sequence of trend lines touches and I was wondering to put 0.618 Fib ratio from touch 1 at support line, up to 3 touch on resistance, and I get number 22000$. I think it could be possible next swing high.
So now we can take our decision to take next trade according to our risk management.
Let luck be on our side.
Best regards,
Artem Shevelev

Bitcoin Price Action Outlook 14 Dec 2020Hey! Looking at the btc price action we can notice several shapes which occuring most of the time during a trend move.
I think most important shape here is triangle. This pattern require patience from the players and need to understand it's nature.
First of all all triangle shapes it is a consolidation period. During which, market players taking one side or another. This causing price fluctuations to stay in some range bound before the one side will take the advantage. In some cases price goes in flat range, in some cases with expanding or narrowing.
But in each case for swing trades it is important to take advantage of this shapes and take right decision for the move.
For bitcoin price we can see it sloping in the apex of triangle, but this shape isn't completely finished yet. Seems like it would have go another week or two for sideways near 19600 and 18500 zone (interest zone on the chart). This zone can be used by day traders to get into positions, as well as swing traders to start opening a initial position with slightly higher risk, but this is depends on your strategy.
My strategy is quite simple, I am splitting position size to few orders in the potential entry levels. And making same thing for take profits. Using OCO type of order I can set SL and TP both to the orders. Using this technic with affordable risk makes stable income from trading for nearly 2 year for me personally. But what work for me, doesn't have to work for you. This is quite fine matter... You have to find out what suits you better.
I hope you enjoying your trading and learning.
Best regards,
Artem Shevelev

Bitcoin Buy Opportunity OutlookHello! Price of BTC reached this year new ATH and so far trying to break It, it is quite strong resistance and psychological level, so breakout from first attempt would not be logical...
From current price action there is possible 2 buy targets (on the chart) according to FIbonacci analysis and Triangle targets.
Similar look price had in May 2020 (remember it?) after halving event.
chart above using 4h timeframe, and moving averages 25/100
PS this is very simple structure now, but it could be hard to trade for novice traders/investors. Be careful, there will be a lot of bear and bull traps.
Best regards,
Artem Crypto

Bitcoin Outlook: Bull Trend Continue or Bearish Reversal?!Here is the update on recent Bitcoin price move and what price action new traders should expect and be ready for.
In video described price action and EMA21 and MA100 price relationship. Buy opportunity and Trend Continuation vs Reversal signals.
If you consider this content useful, let me know by pushing Like :)
Comments and questions are welcome!

Bitcoin Price Update: Expectations and PlanHey! This analysis about price action points and what to expect for mid and short-term on bitcoin. If you find these kind on content helpful and meaningful let me know by hitting like/follow button :)
Stay tuned, and let me know in comment what price action coin to check in next update!

FETCH.AI buying opportunity for mid term +90% profitFET providing buy setup, after breakout from wedge it can increase to the 0.092 or higher. Looking to buy in consolidation period.
SL below support

OMISEGO near important breakoutPrice of OMGUSD broke triangle structure, now faced resistance at 4.42 - important level which will be hard to break. if we going above that level there will be opportunity to reach higher levels.

EOSUSDT holding opportunityEOS price approaching resistance line, we can expect breakout in nearest period, and steady climbing to $8 resistance level.
It is risking to buy below resistance, but it affords a little lower price. This depends on your risk management.
EOSBTC looks great and located at good support here is my old chart

Bitcoin Spot BuyI did a mark up of patterns which i see on daily timeframe and marked elliott waves here. I consider this is 3-rd wave, widest and we can see Media start to pay more attention to the btc and i think we going to see more and more news (in regular media) about bitcoin and crypto.
My forecast for bitcoin here - we are going to approach Supply Zone 20k, where possible shake down to make 4th wave (III-IV). In the middle of V-wave i expect huge jump in prices and very choppy period in correction. Be careful there.
Thanks for attention, let me know what you think about next price action
BR,
Artem Shevelev

AION long term tradeHello!
300-350 consider as buy zone
630-820-980-1200 target zones because of support and resistance
Up to 8 month
Confidence: medium

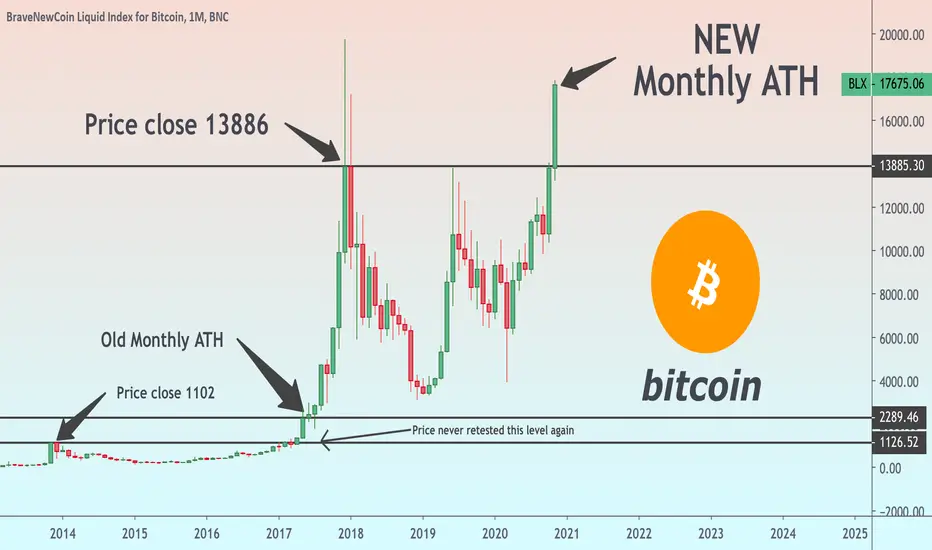
New Monthly ATH (What this mean?)Hey there! Just shifting trough timeframes and notice this interesting fact.
Price on Monthly timeframe broke previous monthly Closing ATH at 13886 and now Monthly Closing price seems like will be higher than ever.
This is awesome fact, because in 2017 we can look at similar output from price.
In May 2017 price of btc broke 2013 ATH Monthly Close at 1102 and NEVER ever back to this price again (yet). I think this is impressive and gives thought about future of Bitcoin in 2021.
Let me know what you think, will price follow same shape this year and next?
Thanks for attention!